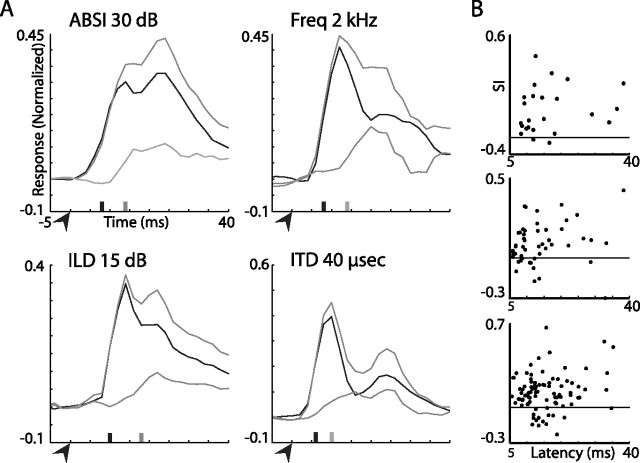
Figure 15.
The onset of SSA effect in the OT. A, A close look at the time window starting 5 ms before and ending 40 ms after the onset of the stimulus is shown for the PSTHs from Figures 13C (ABSI, 30 dB gap), 9C (frequency, 2 kHz gap), 13I (ILD, 15 dB gap), and 10B (ITD, 40 μs gap). The top gray line shows the response to a rarely presented stimulus, the black line shows the response to a frequently presented stimulus, and the bottom gray line shows the difference between the two. The arrowheads indicate the stimulus onset. The black ticks present the latency of the population response to the frequent stimulus and the gray ticks present the latency of the difference signal. B, The stimulus indices versus the latencies to response are shown for frequency tests (top plot), ITD tests (middle plot), and ABSI tests (bottom plot). The horizontal lines designate the zero axes.

