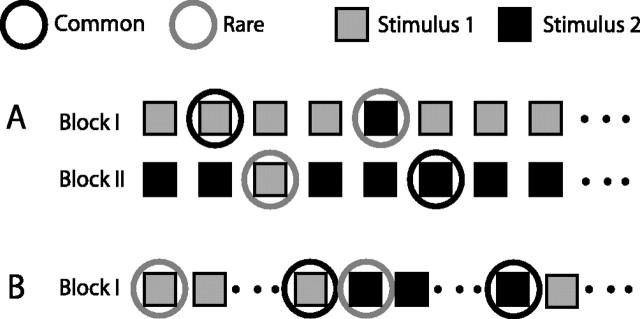
Figure 2.
Auditory stimuli used in the study. A, The oddball stimulus. Sequences of sounds were comprised of two sounds: stimulus 1 was presented frequently (with a probability of 0.85) and stimulus 2 was presented rarely. In the second block, the roles were reversed: stimulus 1 was rare and stimulus 2 was common. B, The constant order stimulus. Long sequences of sounds were comprised of 10 repetitions of stimulus 1 alternating with 10 repetitions of stimulus 2. The response to the first stimulus in a sequence of 10 (rare, gray circle) was compared with the response to the last stimulus in the sequence (common, black circle).

