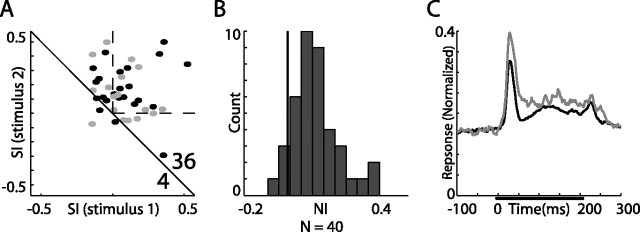
Figure 6.
Summary of frequency oddball tests from all sites recorded in the AGFs. Results are shown for frequency gaps of 2 kHz. A, Scatterplot of SI1 versus SI2. Gray points designate recordings from verified single units. B, Histogram showing the distribution of NIs. C, PSTHs of the averaged normalized response to a rare stimulus (gray line) and to a frequent stimulus (black line). The format is as in Figure 4.

