Figure 1.
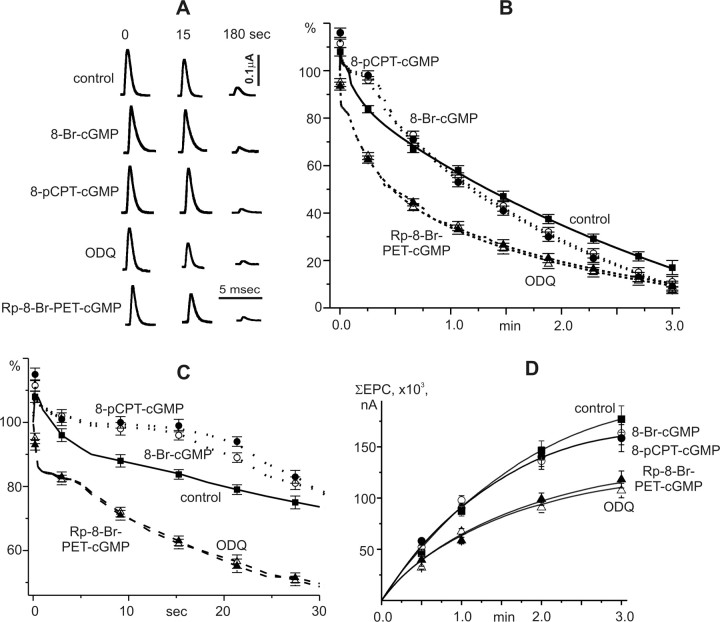
Effects of cGMP analogs, inhibitors of guanylate cyclase, and protein kinase G on EPCs amplitude during prolonged high-frequency stimulation. A, Examples of EPCs, recorded during 20 Hz stimulation for 3 min (0, 15, 180 s) in control and after Br-cGMP, 8-pCPT-cGMP, ODQ, and Rp-8-Br-PET-cGMP application. B, EPCs amplitudes during stimulation for 3 min. C, EPCs amplitudes during first 30 s of stimulation at 20 Hz. y-axis, The amplitude of EPCs as a percentage of the amplitude of the first EPC in the train. D, Cumulative curves of EPCs amplitudes during high-frequency stimulation (in nA). Gray squares, Control; light circles, 8-Br-cGMP (100 μm); black circles, 8-pCPT-cGMP (50 μm); light triangles, ODQ (1 μm); black triangles, Rp-8-Br-PET-cGMP (0.5 μm).

