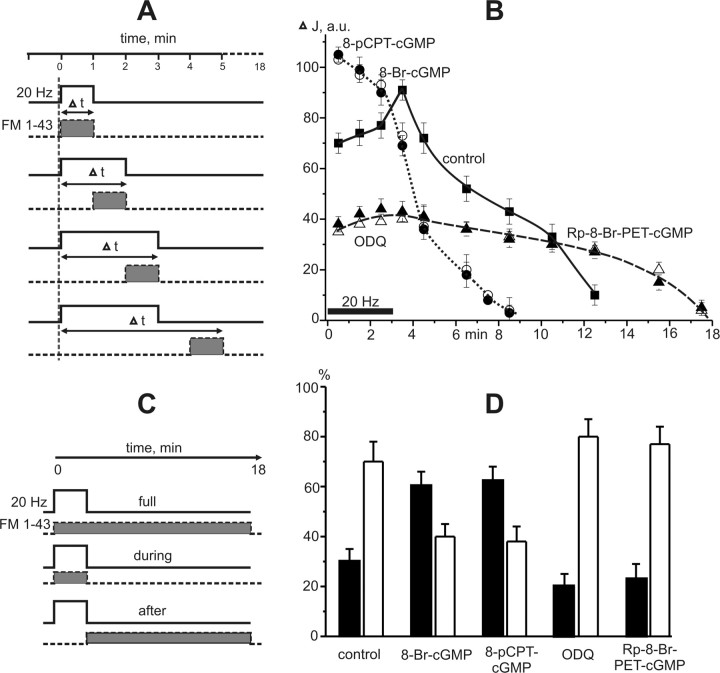
Figure 2.
FM1-43 loading during and after high-frequency stimulation. A, A schematic diagram of the staining protocol. Light columns, with solid line, indicate the period of 20 Hz stimulation. Gray columns, with dotted line, show the time of FM1-43 presence for 1 min during (Δt = 1, 2, 3) and after the end of 3 min stimulation (Δt = 4–18). FM1-43 was applied on the neuromuscular preparation for 1 min and then was quickly washed out with Ringer's solution containing ADVASEP-7 (3 μm). B, Time course of FM1-43 loading in motor nerve terminal. The intensity of nerve terminal fluorescence during and after high-frequency stimulation (per minute dye application). The first three points show the dye uptake during stimulation (20 Hz, 3 min) (horizontal line). y-axis, Fluorescence intensity (ΔJ in a.u.). C, A schematic diagram of the staining protocol. Light columns, with solid line, indicate the period of stimulation (3 min 20 Hz). Gray columns, with dotted line, show the time of FM1-43 application. The total FM1-43 loading: dye was presented during (for 3 min) and after (for 15 min) tetanus. Loading during stimulation: dye was presented only during 3 min tetanus. Loading after stimulation: dye was added to chamber after the end of stimulus train for 15 min. D, The comparison of dye amount (as a percentage) captured during and after high-frequency 3 min stimulation. The solid bars represent loading during stimulation while the open bars represent loading after stimulation. The total uptake of dye (when FM1-43 was presented during and after stimulation, see C) was accepted as 100%. When FM1-43 was presented only during or after stimulation, the nerve terminal staining was less than the brightness of terminals with total dye loading.

