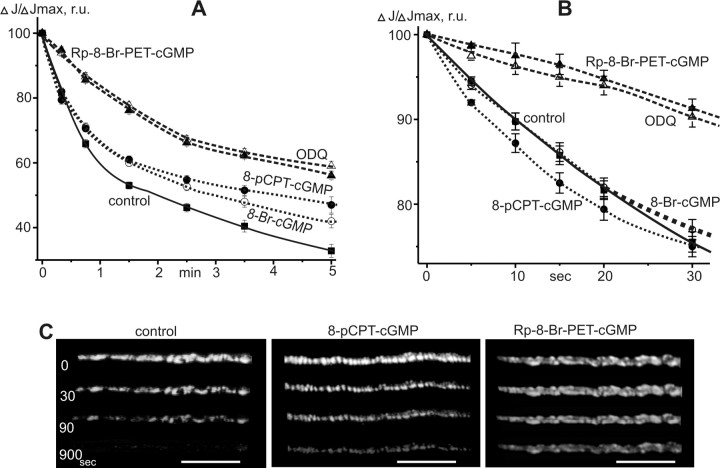
Figure 3.
FM1-43 destaining kinetics in motor nerve terminals. A, The decay of nerve terminal fluorescence during 20 Hz stimulation. B, The curves of dye destaining during first 30 s of stimulation. y-axis, The relative fluorescence intensity (ΔJ/ΔJmax), where 100% represents the intensity before tetanus. x-axis, Time in minutes. C, Change in fluorescent images of nerve terminals during tetanus in control and after treatment by 8-pCPT-cGMP or Rp-8-Br-PET-cGMP (0, 30, 90, 900 s of stimulation). Scale bars, 10 μm.

