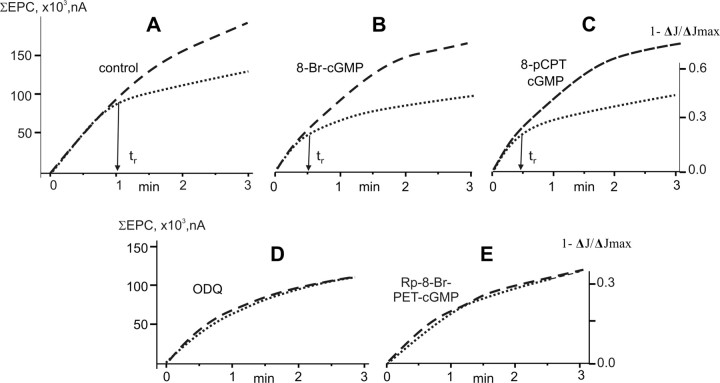
Figure 4.
Calculation of the recycling time of synaptic vesicles. Superposition of the cumulative EPCs amplitude curve and dye loss curve during 20 Hz stimulation (3 min). The dashed line, The cumulative EPCs amplitude curve (in nA) from Fig. 1; dotted line, dye loss curve from Figure 3, which was scaled and superposed with the cumulative EPCs amplitude curve in their initial parts. The average recycle time (tr) is the point where the deviation between two curves becomes apparent. A, Control; B, 8-Br-cGMP; C, 8-pCPT-cGMP; D, ODQ; F, Rp-8-Br-PET-cGMP. y-axes, Summed EPCs amplitude in nA (ΣEPC, right axis), and the decrease of relative fluorescence intensity (1−ΔJ/ΔJmax, left axis). x-axis, Time of stimulation in minutes.

