
Figure 1.
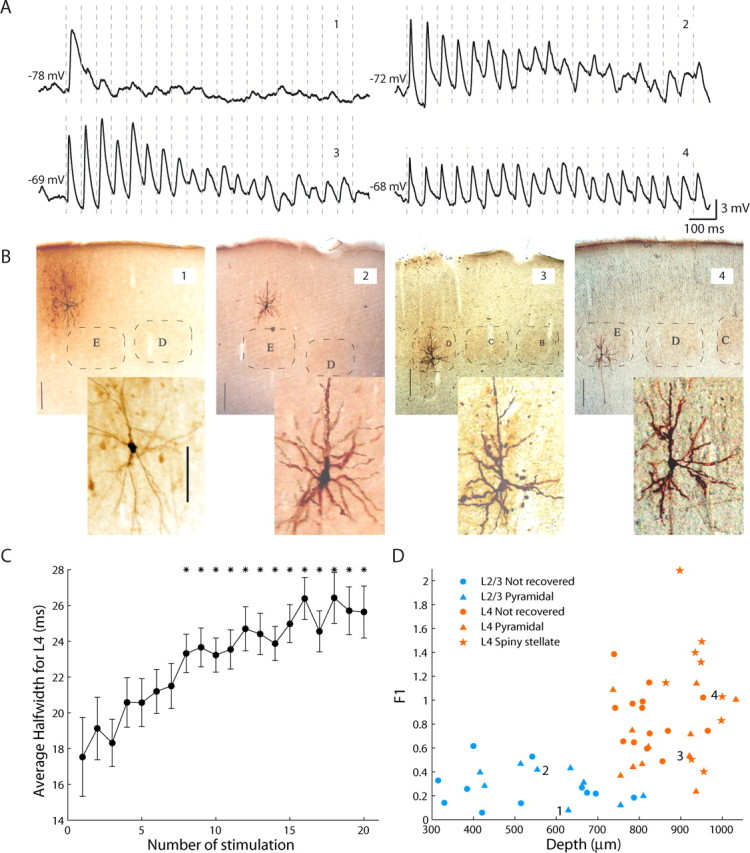
Subthreshold response to repetitive whisker stimulation in the barrel cortex. A, Average membrane potential during 18 Hz whisker stimulation in the barrel cortex. Cells 1 and 2 are from layer 2/3 and cells 3 and 4 are from layer 4. Vertical dashed lines represent times of whisker deflection. B, Histological reconstruction of the recorded neurons. Cells 1–3 are pyramidal and cell 4 is spiny stellate. Black bars correspond to 200 μm after tissue fixation. Insets are enlarged images of the respective neurons. All of the inset images are in the same scale (scale bar in inset of cell 1 corresponds to 50 μm). C, The average half-width of the synaptic potential response increases during repetitive stimulation. Asterisks denote highly significant differences with respect to the first stimulation (p < 0.01), n = 25. Error bars are SEM. D, Responsiveness index (F1) plotted versus the recording depth (manipulator readout) for all recorded cells. Numbered cells (1–4) are the illustrated neurons.