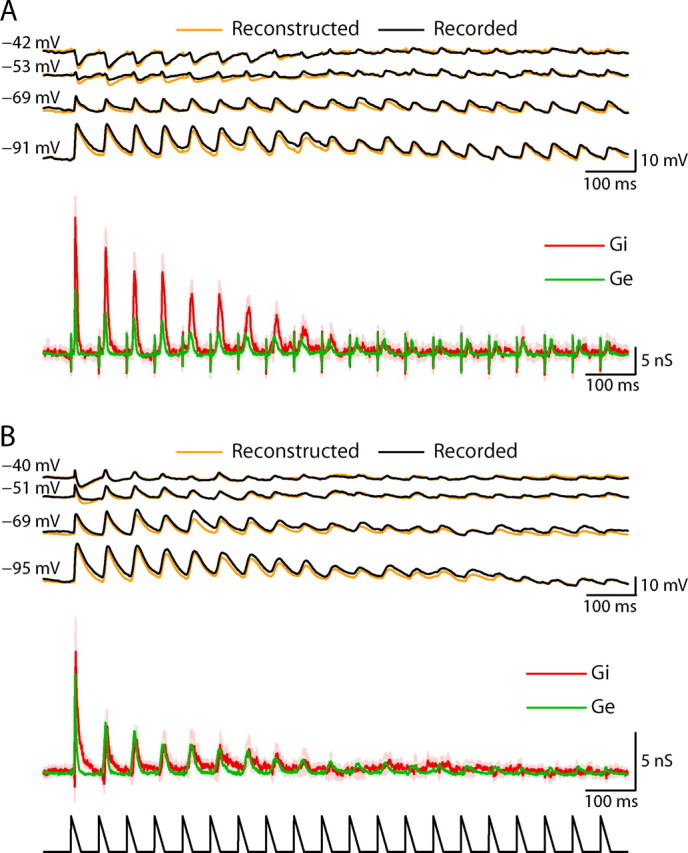
Figure 4.

Averaged response and conductance estimations to repetitive whisker stimulation of two additional cells in layer 4. A, Upper traces: Average responses to repetitive whisker stimulation at 4 levels of current injection (n = 44 trials) of a spiny stellate cell (cell 4 in Fig. 1). Orange traces illustrate the voltage reconstructed from the conductances (see Materials and Methods). Lower traces: Estimates of the changes in excitatory (Ge) and inhibitory (Gi) conductances evoked by repetitive stimulation. Shaded area indicates 95% confidence interval. B, Average response (upper traces) of a pyramidal cell (cell 3 in Fig. 1) recorded at different holding currents (40 repeats of 18 Hz stimulation). Middle traces show the estimated evoked excitation and inhibition and lower trace shows a schematic plot of the whisker stimulation.
