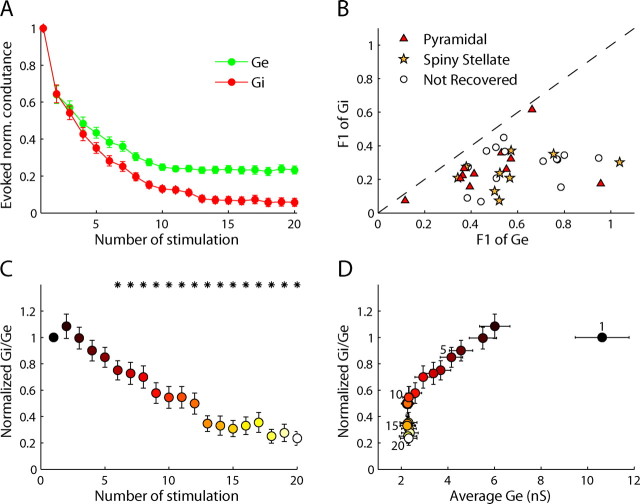
Figure 5.
Dynamics of evoked excitation and inhibition during adaptation. A, Population average of normalized peak excitation (green) and peak inhibition (red) evoked by a train of 20 deflections at 18 Hz (n = 34). B, Scatter plot of the responsiveness (F1 index) of inhibition versus excitation. Note that data points are below the diagonal, indicating that inhibition adapted more than excitation for all of the cells. C, D, Population average of the ratio between peak inhibition and peak excitation for each stimulation plotted versus stimulus number (C) and versus average peak excitatory conductance (D). For each cell the evoked ratio was normalized with respect to the first deflection. Values in y-axis in C and D are the same and are shown with the same color. In D the first deflection is at the rightmost side and the numbers above the data points indicate the deflection number. Highly significant difference with respect to the first deflection is marked by asterisks in C (p < 0.01). Error bars are SEM.

