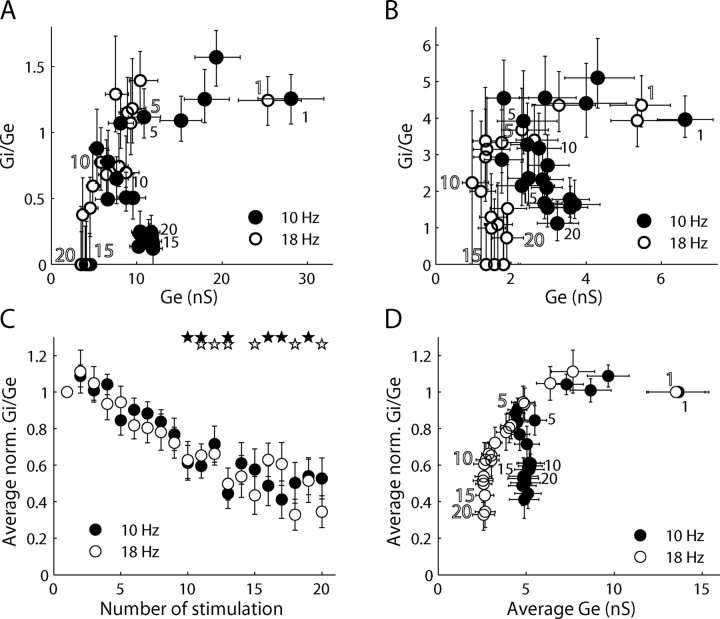
Figure 6.
Balance between excitation and inhibition measured at two stimulation frequencies. A, B, Examples of Gi/Ge as a function of peak evoked excitation (Ge) measured at 10 and 18 Hz whisker stimulation for two different neurons. The behavior was similar, although one cell was recorded under isofluorane anesthesia (A) and the other under halothane anesthesia (B). Error bars denote 95% confidence interval. C, D, Population average of the ratio between inhibition and excitation (normalized for each cell by the first stimulus) plotted as a function of stimulation number (C) and as a function of peak excitation (D). Stars mark significant differences with respect to the first deflection (p < 0.01). Error bars are SEM (n = 12). Numbers adjacent to the data points (every fifth stimulation) denotes the respective number of stimulation (10 Hz by filled numbers and 18 Hz by outlined numbers).

