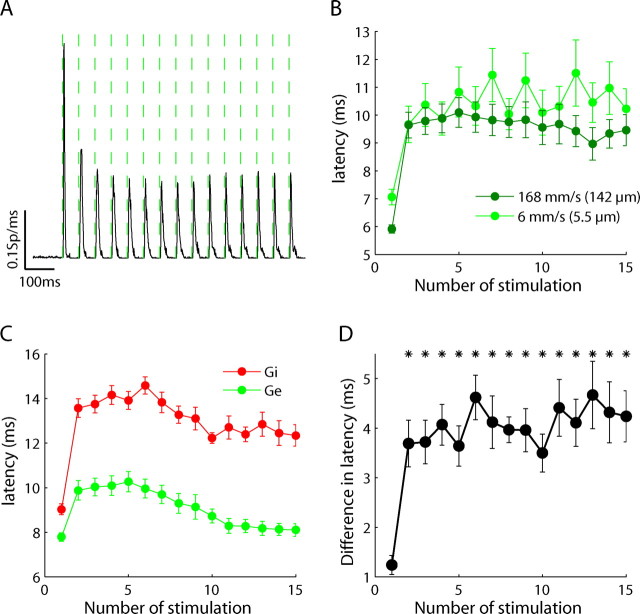
Figure 7.
Latencies of thalamic firing and cortical evoked synaptic conductances during repetitive whisker stimulation. A, Average PSTH of 27 thalamic units stimulated at 18 Hz by strong whisker stimulation (168 mm/s with an amplitude of 142 μm). Dashed lines mark the time of stimulation of each deflection. B, Average latency of the thalamic units under strong whisker stimulation (dark green) with the parameters described in A, and light green for weak stimulation (6 mm/s, amplitude of 5.5 μm). C, Latency of evoked excitation and inhibition at layer 4. D, Difference between the latency of evoked inhibition and of evoked excitation at layer 4. Asterisks mark significant differences with respect to the first stimulation (p < 0.01). Error bars are SEM.

