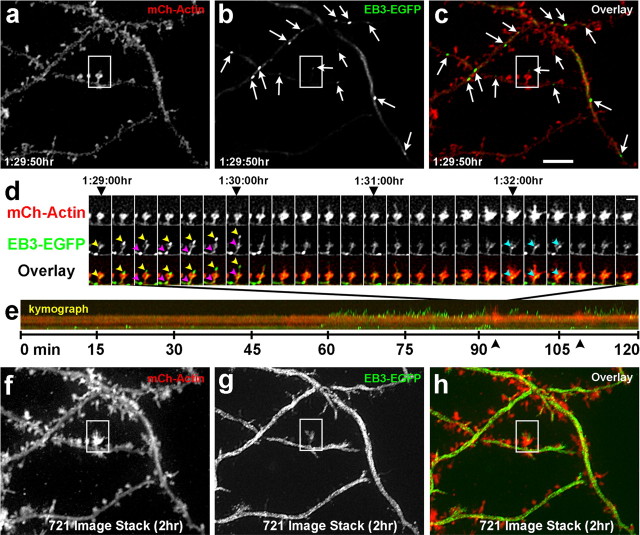
Figure 6.
Microtubules remain dynamic throughout the life of the neuron and continue to invade dendritic spines. Fluorescent images of a DIV 63 hippocampal neuron transfected with mCherry-β-actin (a) and EB3-EGFP (b) at the time of plating. Arrows in b and c point to EB3 puncta (polymerizing MTs). c, An overlay image of the mCherry-β-actin (red) and EB3-EGFP (green) images. d, A montage of a single spine (boxed in a–c) from 1:29:00 to 1:32:50 h in the 2 h sequence. One MT polymerizes into the spine (yellow arrowheads point to an EB3-EGFP punctum in both the EB3-EGFP and overlay rows) in association with a tSHP and extends to its tip. Another MT (magenta arrowheads point to a second EB3-EGFP punctum) polymerizes into the spine behind the first MT but only extends to the spine head. A third MT (cyan arrowheads) extends into the head of the spine (1:32:00–1:32:20) during the time the actin becomes markedly dynamic (1:31:10–1:32:40), forming transient filopodia and lamellipodia. e, Kymograph of the entire 2 h sequence showing no MT activity during the first hour but multiple MT excursions (short green lines) interspersed by dramatic actin-based protrusions (black arrowheads) during the second hour. f–h, Same regions as in a–c except that these images are composites of all 721 images in the 2 h time lapse stacked into one image to show movement of actin and EB3. Note that there is so much activity of MTs in the dendrite shafts that they appear white, whereas a single frame shows only bright dots with some background of free EB3 (b). Scale bars: (in c) a–c, f–h, 5 μm; (in d, last mCh-actin image) d, e, 2 μm.

