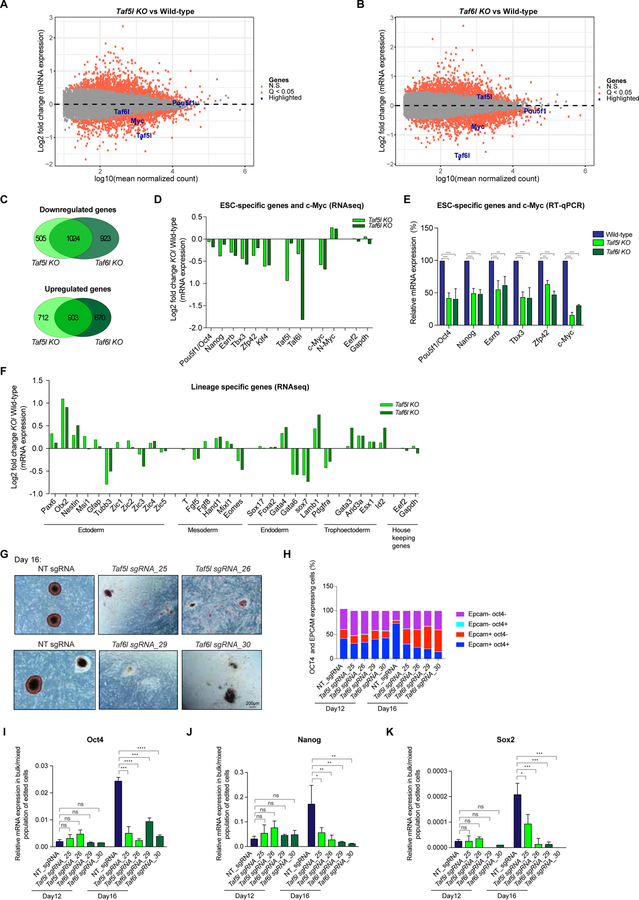
Figure 3. TAF5L and TAF6L are required for gene expression programs of mESC state; and for somatic cell reprogramming/iPSCs generation.
(A, B) Scatter plots showing differentially expressed genes from Taf5l KO (A) and Taf6l KO (B), compared to wild-type mESCs. Orange dots are significantly up and downregulated genes in Taf5l and Taf6l KOs with a q-value <0.05. Grey dots are unaltered genes in KOs compared to wild-type. Genes of interest are labelled in the scatter plot.
(C) Venn diagrams represent overlapped up or downregulated genes between Taf5l KO and Taf6l KO.
(D) mRNA expression levels of mouse ESC-specific genes, c-Myc and N-Myc in Taf5l and Taf6l KOs compared to wild-type (from RNAseq). Eef2 and Gapdh used as internal controls.
(E) mRNA expression levels of mouse ESC-specific genes and c-Myc in Taf5l and Taf6l KOs compared to wild-type (from RT-qPCR). mRNA levels were normalized to GAPDH.
(F) mRNA expression levels of lineage-specific genes in Taf5l and Taf6l KOs compared to wild-type (from RNAseq).
(G) AP staining of transgene-independent iPSC colonies following reprogramming (at day 16). Scale bar is 200µm.
(H) FACS analysis showing quantification of relative percentages of OCT4 and EPCAM expressing cells after reprogramming at day 12 and day 16.
(I-K) mRNA expression levels of ESC Core TFs– endogenous Oct4, Nanog, Sox2 in bulk/mixed populations of edited cells after reprogramming at day 12 and day 16, upon perturbation of Taf5l and Taf6l using sgRNAs. Non-targeting sgRNA used as control.
Data are represented as mean ± SEM (n = 3); p-values were calculated using ANOVA. *p < 0.05; **p < 0.01; ***p < 0.001; ****p < 0.0001; and ns (non-significant).
Related to Figure S3.

