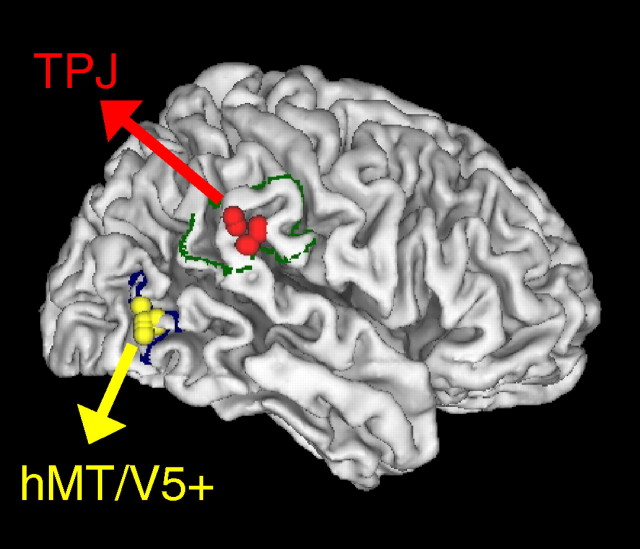
Figure 1.
Stimulation sites. The contours of the target regions of interest are plotted (green TPJ, blue hMT/V5+) on a 3D rendering of the right hemisphere of the MNI brain template. The locations of the stimulation sites in the two groups of subjects of protocol 1 are shown for TPJ (red) and hMT/V5+ (yellow).

