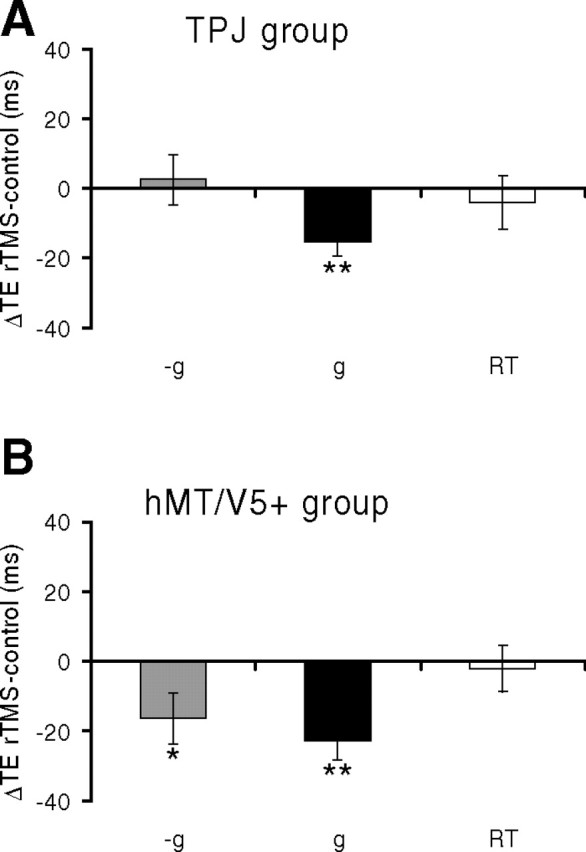
Figure 4.

Interception of vertically moving targets (protocol 1). rTMS was applied over right TPJ (A) or hMT/V5+ (B). Bar graphs report mean differences (±SEM) of the timing errors (TE) between post-rTMS and pre-rTMS trials, pooled across all trials of all subjects. Negative (positive) values of ΔTE correspond to responses earlier (later) than the control responses. Gray: −g trials; black: g trials; white: RT trials. Statistically significant effects are indicated with asterisks: *p < 0.05; **p < 0.001 (repeated-measures ANOVA).
