
Figure 5.
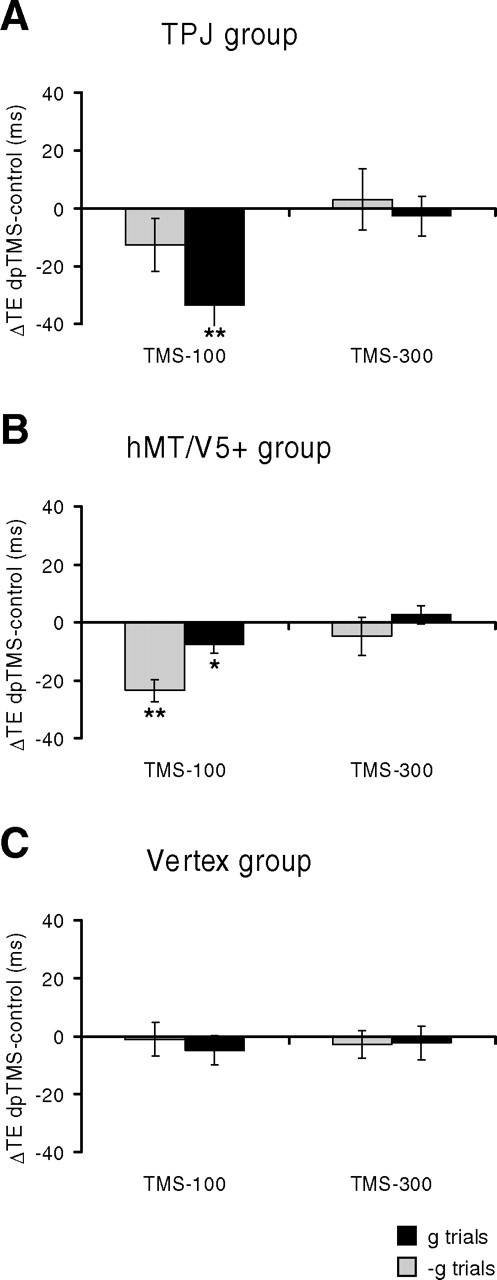
Results of protocol 2. dpTMS was applied over right TPJ (A), hMT/V5+ (B), or vertex (C). Bar graphs report mean differences (±SEM) of TE between either dpTMS-100 or dpTMS-300 trials and no-TMS control trials, pooled across all trials of all subjects. Other conventions as in Figure 4.