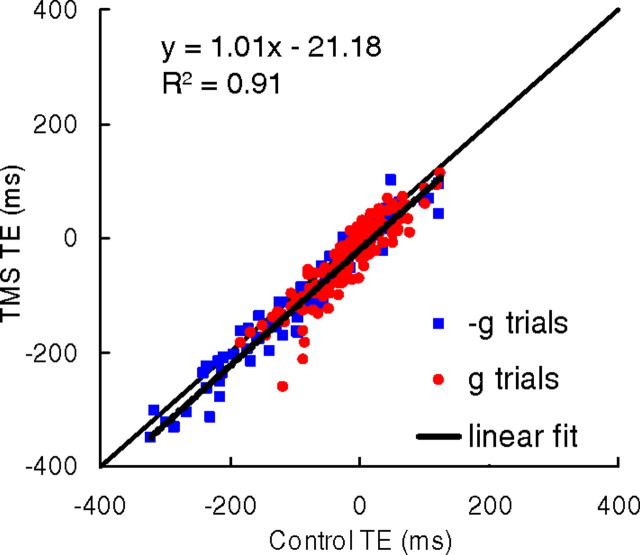
Figure 8.
Timing errors (TE) in TMS trials vs timing errors in control trials. Each point is the mean value (across all repetitions) of TE for a given subject, motion duration, trial type (g or −g), and protocol. Data (n = 216) correspond to all g trials with TMS on TPJ, all g and −g trials with TMS on hMT/V5+. Identity line (perturbed TE = control TE) and least-squares regression line across all data are plotted as thin and thick lines, respectively. Regression parameters are indicated in the inset.

