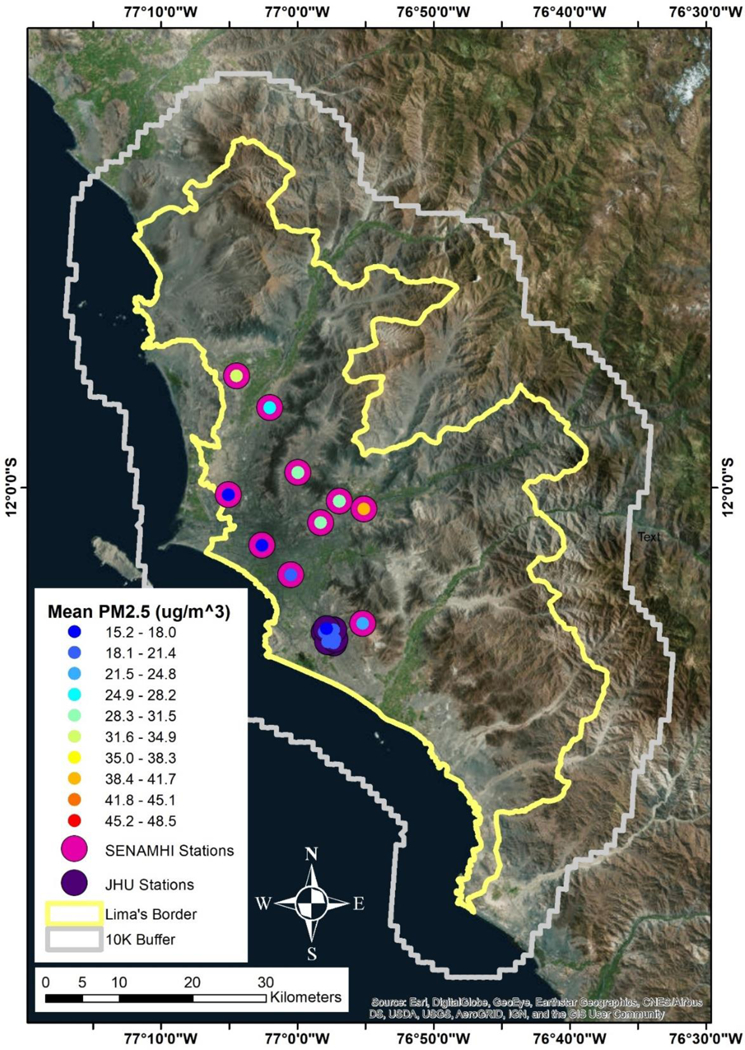
Figure 1.

Study domain and location of air monitors. The yellow line details the Lima political border while the gray line details the 10 km buffer. The; magenta circles denote the location, distribution, and overall mean PM2.5 concenttations in μg/m3 of the Servicio Nacional de Meteorología e Hidtología del Perú (SENAMHI) monitor network, while the purple circles denote the same information for the Johns Hopkins University (JHU) monitor network:.
