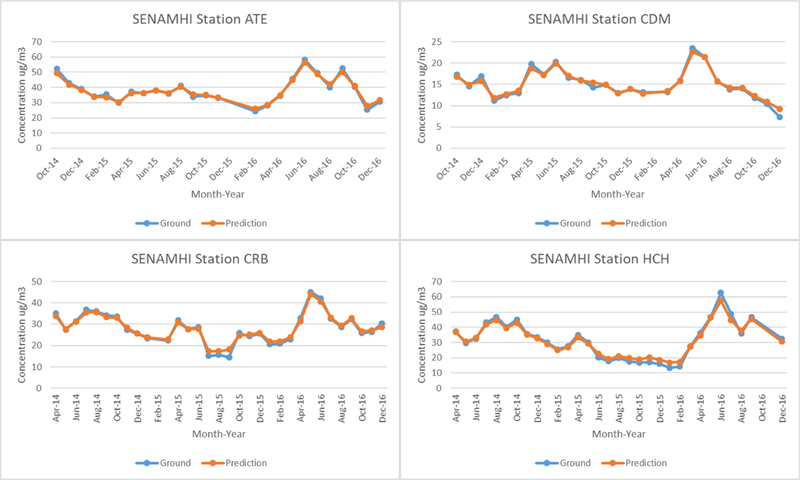
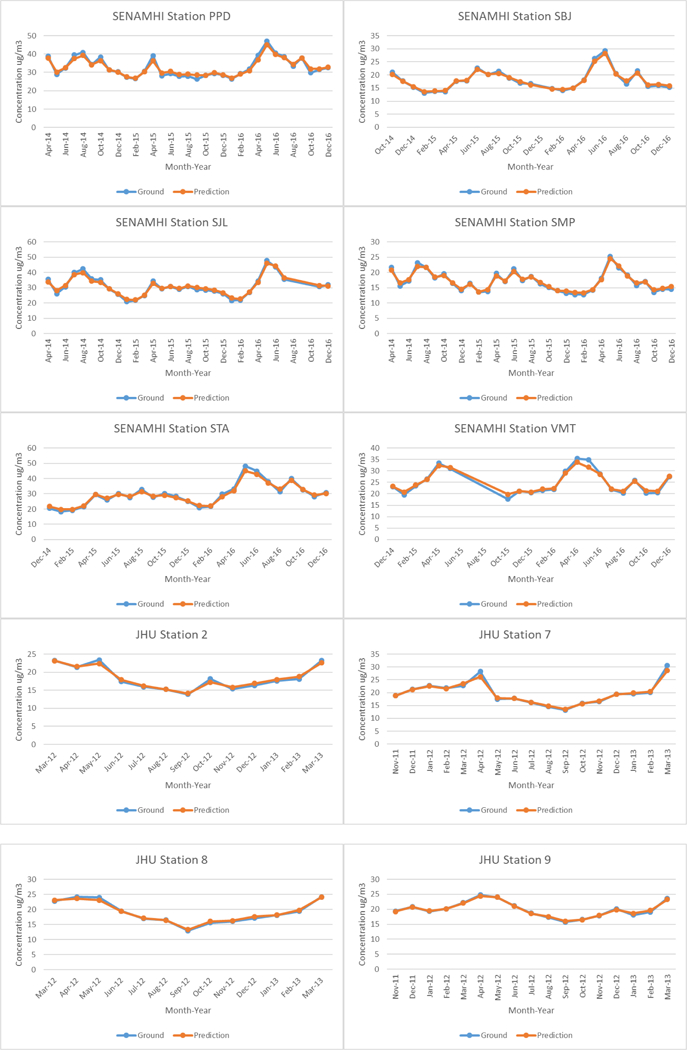
Figure 5.


Time series of monthly mean ground measurements and predicted PM2.5 in μg/m3 based on random forest model at each monitor station. SENAMHI station names are abbreviated from the name of the location.


Time series of monthly mean ground measurements and predicted PM2.5 in μg/m3 based on random forest model at each monitor station. SENAMHI station names are abbreviated from the name of the location.