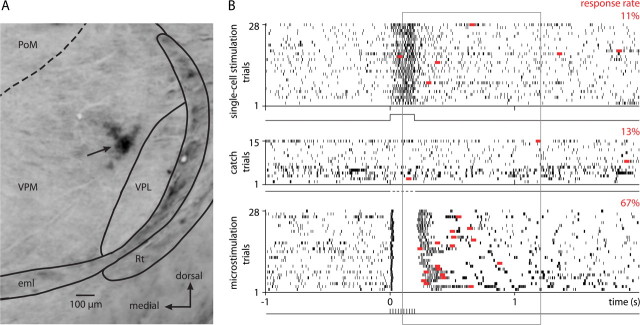
Figure 2.
Behavioral responses during a single-cell stimulation experiment in VPM. A, The thalamic recording site, marked by an electrolytic lesion (arrow). Coronal section, 3.6 mm posterior to bregma. eml, External medullary lamina; PoM, posterior medial nucleus; Rt, reticular nucleus; VPL, ventral posterior lateral nucleus; VPM, ventral posterior medial nucleus. The dashed line indicates the putative border between VPM and PoM. B, Action potential raster plot (black tick marks) and first lick responses (red squares) during single-cell stimulation trials (top trace), catch trials (middle trace), and 28 randomly picked microstimulation trials (bottom trace). Stimulation currents were 16 nA for single-cell stimulation and 6–7 μA for microstimulation. Response rates (fraction of first licks in the response window) for the three different trial types are indicated above each raster plot.

