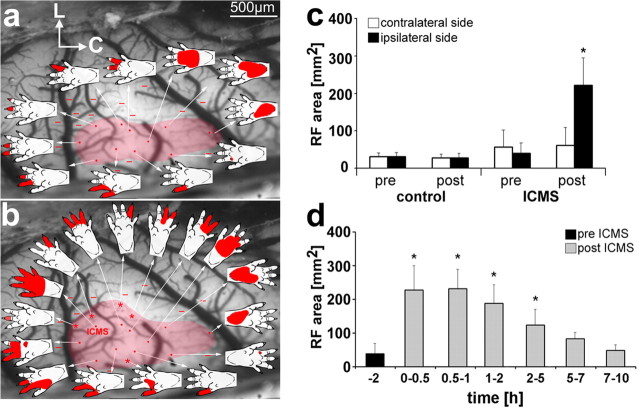
Figure 2.
Somatosensory mapping of the hindpaw representation before (a) and after (b) ICMS. L, Lateral; C, caudal. Dots indicate recording sites with the appending receptive field (indicated by the arrow). Bars show recording sites, which are unresponsive to tactile stimulation. Asterisks mark newly accrued receptive fields after ICMS (b). Receptive field size from both hemispheres of control (sham) and stimulated animals (c). Time course of receptive field changes before (pre ICMS) and after 2 h of electrical stimulation (post ICMS) over an interval of 10 h after stimulation compared with preconditions (d). *p < 0.05.

