
Figure 5.
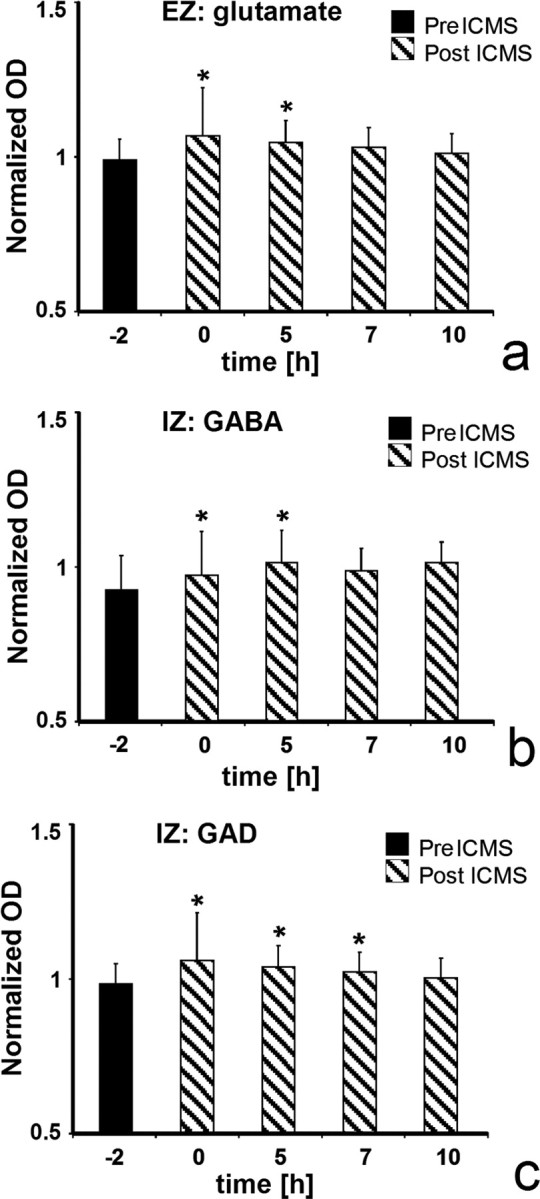
Optical density of glutamate (a), GABA (b), and GAD (c) at different time points after ICMS from the different zones (Fig. 4c,f,l). For comparison, see time course of changes in RF size (Fig. 2d). Because the OD of the immunoreactivity of animals differ, the data were standardized, to compare among animals. The OD of each individual measure was divided by the average value of all stained sections from the same animal and same marker. IZ, Inhibition zone.