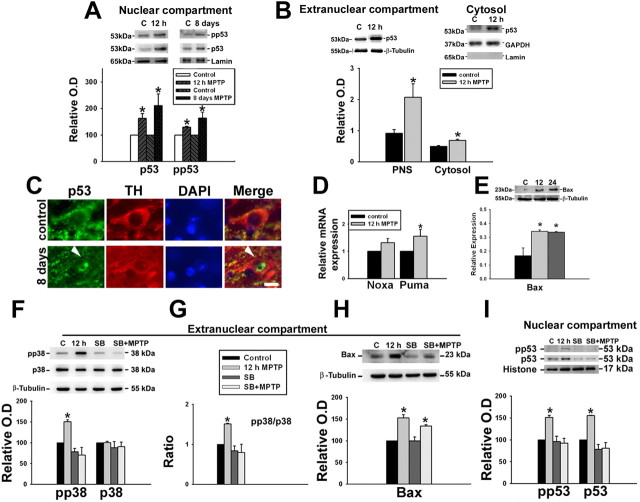
Figure 4.
MPTP administration up-regulates p53 and induces p53 mediated transactivation, in vivo. Animals were treated with a single dose of vehicle or MPTP and killed 12 and 24 h later or with a daily dose of MPTP for 8 d and killed on the ninth day. A, pp53 (Ser15) accumulates in the nucleus 12 h after a single dose of MPTP and after subchronic exposure to MPTP for 8 d. Representative immunoblots of nuclear p53 and phospho-p53 Ser15 with their densitometric analyses are depicted. Values are mean ± SD (n = 7 animals). B, Representative immunoblot of extranuclear and cytosolic p53 in ventral midbrain (MB) and densitometric analyses of the post nuclear supernatant (PNS) and cytosolic p53 show the upregulation after MPTP exposure. Values are mean ± SD (n = 6 animals). C, Quantitative assessment of the expression of Noxa and Puma in ventral midbrain after MPTP treatment. qRT-PCR analysis using mouse ventral midbrain RNA shows relatively higher expression of Noxa and Puma in mouse ventral midbrain after MPTP treatment for 12 h. All samples were normalized using 18S rRNA expression. Values are mean ± SD (n = 6 animals). D, Representative immunoblot for Bax from ventral midbrain (MB; n = 5) of animals and densitometric analyses are shown. E, Animals were treated with a single dose of vehicle (3% DMSO) or MPTP and killed 12 h later. Some animals also received a single dose of SB239063 intrathecally. E–G, Representative blots from ventral midbrain of animals treated with DMSO (lane 1), MPTP (lane 2), SB239063 (lane 3), and SB239063 + MPTP (lane 4) depicting the protein levels of phospho-p38, p38, and Bax (G) in the extranuclear compartment and pp53 Ser15 and p53 (F) in the nuclear compartment as determined by immunoblot are presented. pp38/p38 ratio represents p38 activation in ventral midbrain. Densitometric analysis of the immunoblots representing the relative intensity of the immunoreactive bands are shown. Values are mean ± SD (n = 4 animals). β-Tubulin levels were measured as loading control for extranuclear compartment and lamin/histone levels were measured as loading control for nuclear compartment. Asterisks indicate values significantly different from corresponding control (p < 0.05). Statistical analysis using t test for A–E and repeated measures of ANOVA followed by Dunnet's test was performed for F–I.

