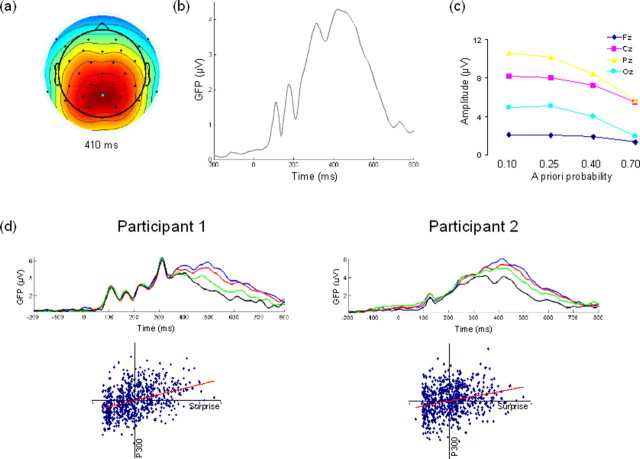
Figure 2.
Electrophysiological data. a, Scalp distribution (electrode Pz marked in cyan). b, Grand average waveform at electrode Pz. c, Average single-trial amplitude per stimulus category over midline electrode sites, showing effects traditionally reported for the P300. d, Results for two representative participants showing evoked potentials averaged to relative occurrence of stimuli each block (top right, 0.10 in blue, 0.25 in red, 0.40 in green, 0.70 in black) (top) and scatter plot of single-trial ERP amplitudes and blockwise surprise Ib (bottom). Scatter plot data were normalized for display purposes only. For ERPs, only the 200 ms before stimulus presentation (at time 0) to 800 ms following stimulus presentation interval is plotted, for display purposes only.

