Figure 1.
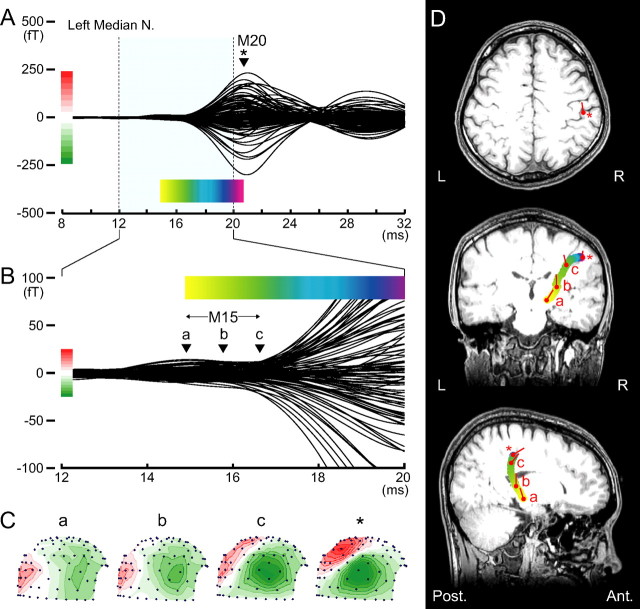
Somatosensory magnetic fields following left median nerve stimulation in a 23-year-old man. A, Superimposed waveforms recorded from the right hemisphere (80 locations) show a clear M20 magnetic deflection; at 20.6 ms (*) after stimulus onset, the ECD is estimated in hand area of the postcentral gyrus on the right side (D, top). B, M15 deflection before M20 onset, lasting from 14.9 (a) to 16.7 (c) ms poststimulus, is highlighted with expanded scales for both magnetic strength and time. C, Right lateral view of isocontour field distributions of the magnetic field over the head surface at 4 time points; red contours, magnetic flux-out; green contours, flux-in with contour step of 3 fT for the latency of a–c in B and 30 fT for M20 peak (asterisk) in A. Note that the long distance between the maximum flux-out and minimum flux-in and wide intervals between any adjacent contour lines for flux-out or flux-in (a and b) suggest deep current sources. In contrast, the short distance between the maximum flux-out and minimum flux-in and narrow intervals between the adjacent contour lines (c and asterisk) indicate superficial current sources. D, Estimated ECDs superimposed onto the subject MRI (from top; horizontal, coronal and sagittal views). Changes in locations of the ECDs calculated successively at a 0.1 ms step until the M20 peak are illustrated as a colored curve, in which color gradation from yellow to purple corresponds to the time course of the colored bar in A or B. Note that S-shaped colored curve in the coronal view indicates sequential changes in ECD location from thalamus (yellow) to primary somatosensory cortex (purple), demonstrating impulse propagation along the thalamocortical fibers. Red circles and bars indicate the location and orientation of ECD for the latency of a–c in B or an asterisk in A.

