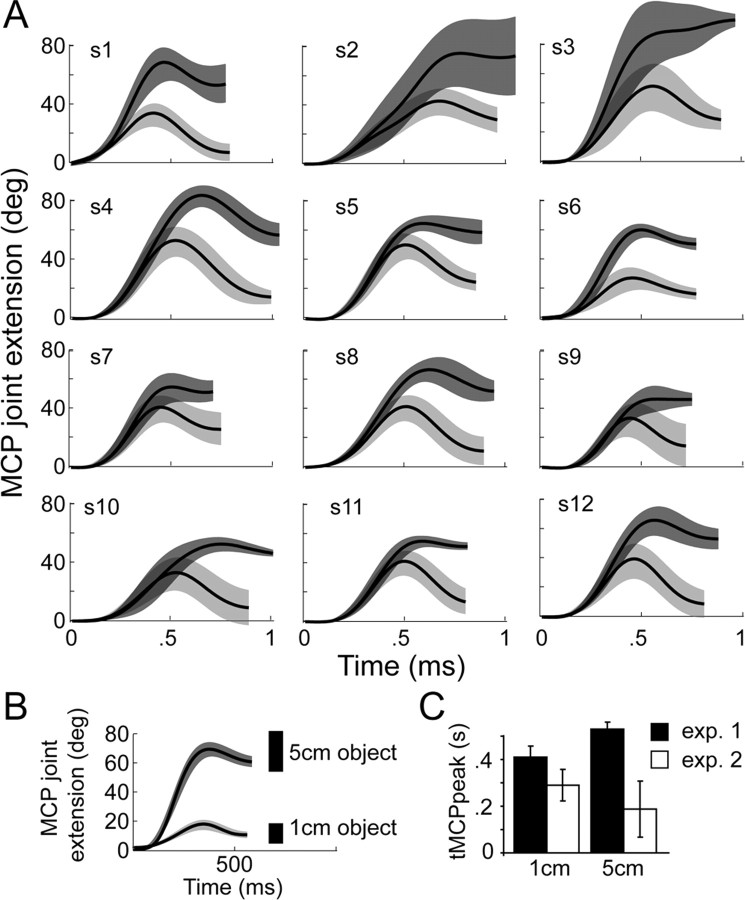
Figure 1.
A, Mean MCP angle ± 1 SD (shaded regions) (y-axis) profiles for 12 subjects in the perturbation experiment (experiment 1). The perturbation occurred from 1 to 5 cm. Light gray, 1 cm object; dark gray, 5 cm object. B, The mean MCP angle ± 1 SD plotted over time for a representative subject in experiment 2 (no perturbation). C, The mean ± 1 SD time to peak MCP angle in the perturbation (experiment 1) and no-perturbation (experiment 2) experiments.

