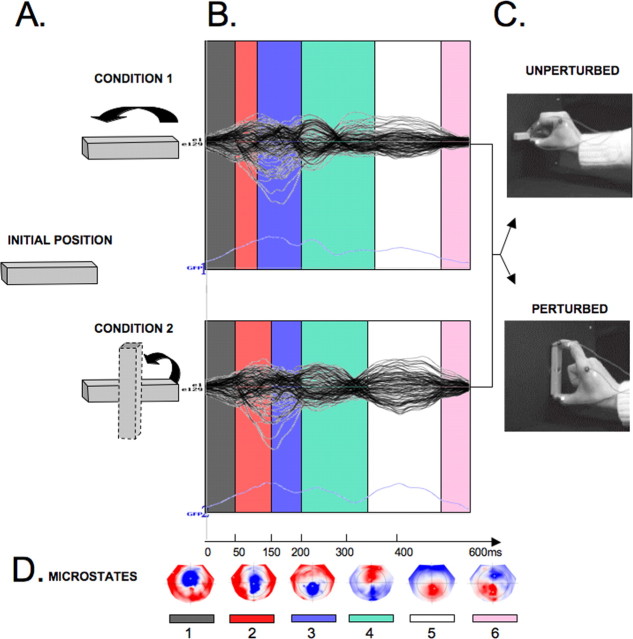
Figure 2.
Brain microstates and topographies. A, Stimulus orientation for the two conditions at task and movement onset. Upper row is UNPERTURBED and lower row is PERTURBED trials. B, The topographic pattern analysis identified six time periods of stable topography (color coded) across the 600 ms poststimulus period. Modulations of global field power are plotted in light blue across time in the bottom section. C, Movement outcome for each condition D, Maps of topographies corresponding to the six microstates in B, with the nasion upward and left scalp leftward, with red positive and blue negative.

