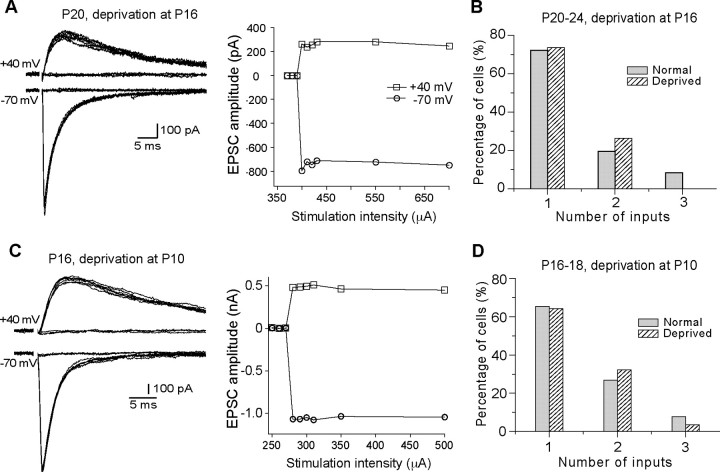
Figure 2.
A critical window for the effect of whisker deprivation on synapse elimination. A, Left panel, Synaptic currents at different stimulus intensity recorded from a neuron at P20 following whisker deprivation at P16; right panel, plot of peak amplitude versus stimulus intensity. B, The distribution of neurons (n = 19) in deprived VPm at P20–P24 following whisker deprivation started at P16 and that from normal mice at P20–P24 (in gray; the same data as in Fig. 1D). C, Synaptic responses and the plot of current versus intensity obtained from a neuron at P16 following whisker deprivation at P10. D, The distribution of neurons in deprived VPm (hatched; n = 28) at P16–P18 following whisker deprivation started at P10 and that from normal mice at P16–P18 (gray; the same data as in Fig. 1C).

