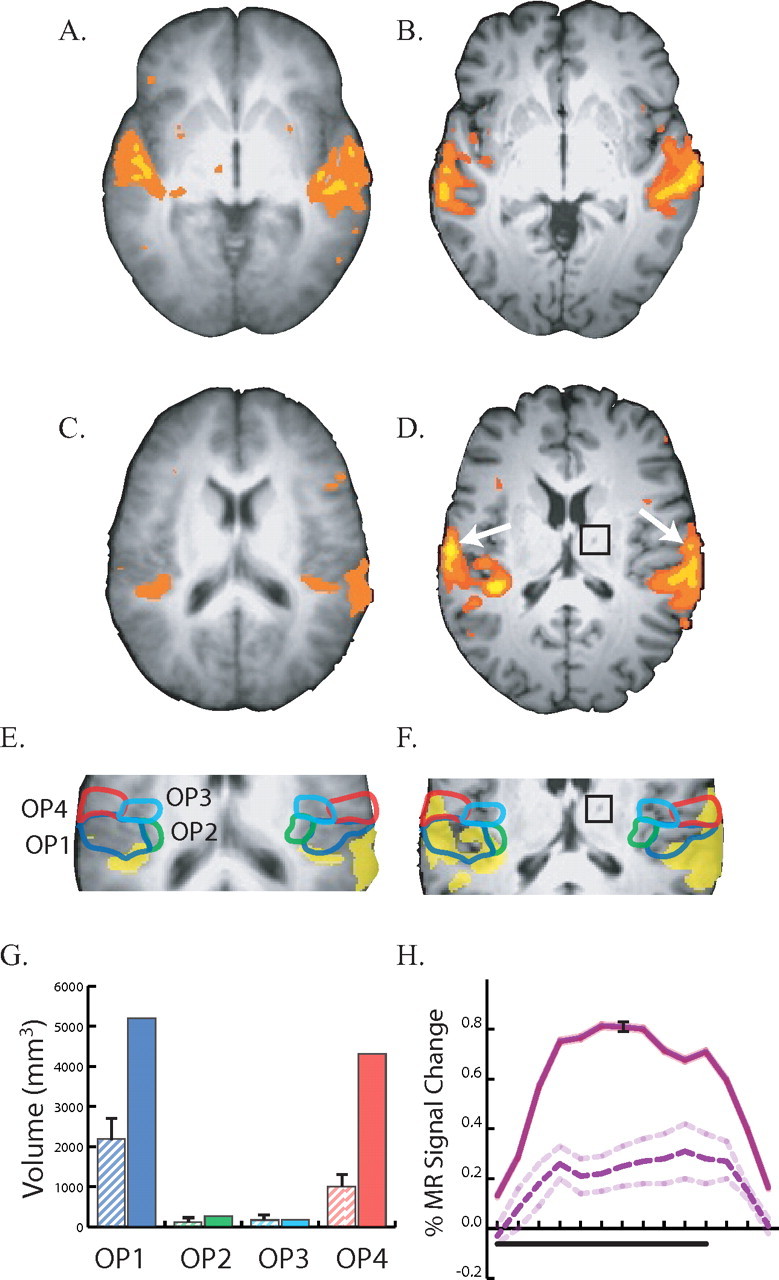
Figure 1.

Responses to auditory stimulation in controls (A, C, E) and the patient (B, D, F). A, An axial slice at the location of auditory cortex (z = 0 mm). Underlay shows average anatomical dataset from nine normal controls; colored voxels show significant responses to auditory stimulation (p < 0.01 corrected). Left is left in all figures. B, Responses to auditory stimulation in auditory cortex (z = 0 mm) of the patient. C, An axial slice through secondary somatosensory cortex (z = 17 mm) in the parietal operculum in an average control dataset, showing weak auditory responses. D, Strong auditory responses in the patient's operculum (z = 17 mm), highlighted with white arrows. The black square shows the location of the thalamic lesion in the patient's right thalamus. E, Enlarged view of the operculum in normal controls. Active voxels are colored yellow; colored outlines show cytoarchitectonic subdivisions of the operculum. Blue line, OP1; green line, OP2; cyan line, OP3; red line, OP4. F, Enlarged view of opercular auditory responses in the patient with cytoarchitectonic boundaries (black square shows thalamic lesion). G, Volume of cortex responding to auditory stimulation in four cytoarchitectonic subdivisions of the operculum. The label under each pair of bars identifies the subdivision. The left hatched bar in each pair shows the mean ± SEM volume in nine normals; the right solid bar shows the volume in the patient; bar colors correspond to outline colors in E. H, Evoked response to auditory stimulation. Black bar under x-axis shows duration of a block of 10 different 2 s auditory stimuli. Solid purple line shows mean time series from OP1 and OP4 in the patient (black error bars show SEM). Dashed purple line shows mean time series from OP1 and OP4 in nine normal controls (dashed line shows SEM).
