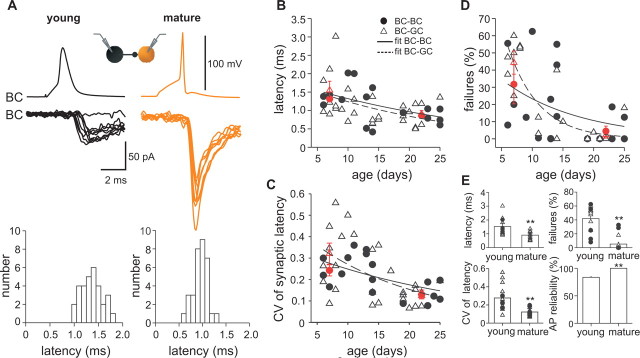
Figure 5.
Precision of quantal GABA release at BC output synapses increases during postnatal development. A, Single action potentials (top traces) evoke single unitary IPSCs (bottom traces) in a young (P6; left) and a mature (P21; right) BC–BC pair. Eight unitary IPSCs are superimposed. Synaptic latency histograms of unitary IPSCs are shown below the traces for the same paired recordings (left, young BC–BC pair; right, mature BC–BC pair). B–D, Summary plot of synaptic latencies (B), the CV of synaptic latencies (C), and the proportion of transmission failures (D), at both BC–BC (filled circles) and BC–GC (open triangles) synapses at various postnatal ages. Lines correspond to exponential functions fitted to the data from BC–BC (continuous line) and BC–GC (dashed line) pairs. Red circles represent average values from BC–BC pairs, and red triangles represent average values from BC–GC pairs in the age range of P6–P10 and of P18–P25. E, Summary bar graphs of synaptic latency, CV of synaptic latencies, and transmission failures at young (P6–P10) and mature (P18–P25) BC–BC (filled circles) and BC–GC (open triangles) synapses. The bottom right bar graph summarizes the reliability of antidromic action potentials (AP) recorded at the soma of young and mature BCs during extracellular stimulation in the GC layer for direct comparison. **p < 0.01.

