
Figure 8.
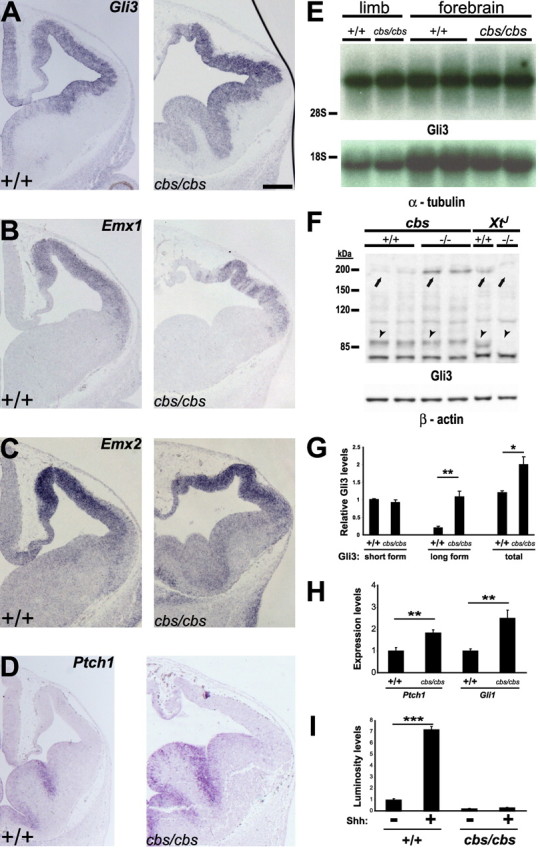
Targets of Shh signaling and Gli3 protein processing are disturbed in the forebrain of cbs mutants. A–D, In situ hybridization analysis of 12.5 wild-type and cbs/cbs embryos. For each coronal section, only one telencephalic half is shown, with dorsal to the top, lateral to the right. Scale bars: 300 μm. A, Gli3. B, Emx1. C, Emx2. D, Ptch1. E, Northern blots of whole RNA from forebrain of E12.5 wild-type and cbs/cbs embryos. Full-length Gli3 (top) and α-tubulin cDNAs (bottom) were used as probes. Ribosomal RNA markers are to the left. F, Western blots of protein from forebrain of E12.5 cbs and XtJ wild-type (+/+) and homozygous mutant (−/−) embryos. An anti-N-terminal-Gli3 antibody (top) and an anti-β-actin antibody (bottom) were used. Specific bands corresponding to the 190 kDa full-length Gli3 isoform (arrows) and the 80 kDa proteolytically processed Gli3 isoform (arrowheads) are indicated. The specificity of the antibody was shown by examining homozygous Gli3 deletion mutants (XtJ), in which neither full-length nor processed Gli3 isoforms are detectable. Protein markers (kDa) are to the left. G, Quantitation of Gli3 Western blots seen in (F), first indicating the amount of the 90 kDa (short form) Gli3 isoform, setting levels in +/+ to 1.0. A quantitative comparison of the 190 kDa (long form) isoform shows 19.4% levels in +/+ embryos, compared with the short form. cbs/cbs mutants show a 5.6-fold increase in the amount of the long form, compared with +/+ embryos, to levels greater than that of the short form in cbs/cbs embryos. The combined amount of short and long isoforms is also indicated (total). H, Quantitative real time RT-PCR was performed upon mRNA extracted from E12.5 telencephalon. Reverse-transcribed cDNA was analyzed using TaqMan probes recognizing Ptch1 and Gli1. cDNA was normalized using probes for GAPDH. I, Luciferase assays using a Gli-responsive luciferase plasmid transiently transfected into fibroblasts prepared from wild-type and cbs/cbs embryos and allowed to reach confluency. Sonic hedgehog (Shh, 1 μg/ml) was added to the cultures for 12 h before lysis and analysis of luciferase levels. Relative luminosity levels relative to Shh-untreated wild-type cells are indicated. G–I, Mean values ± SEM (n = 4–8). ***p < 0.001, **p < 0.01, *p < 0.05, Student's t test.