
Figure 2.
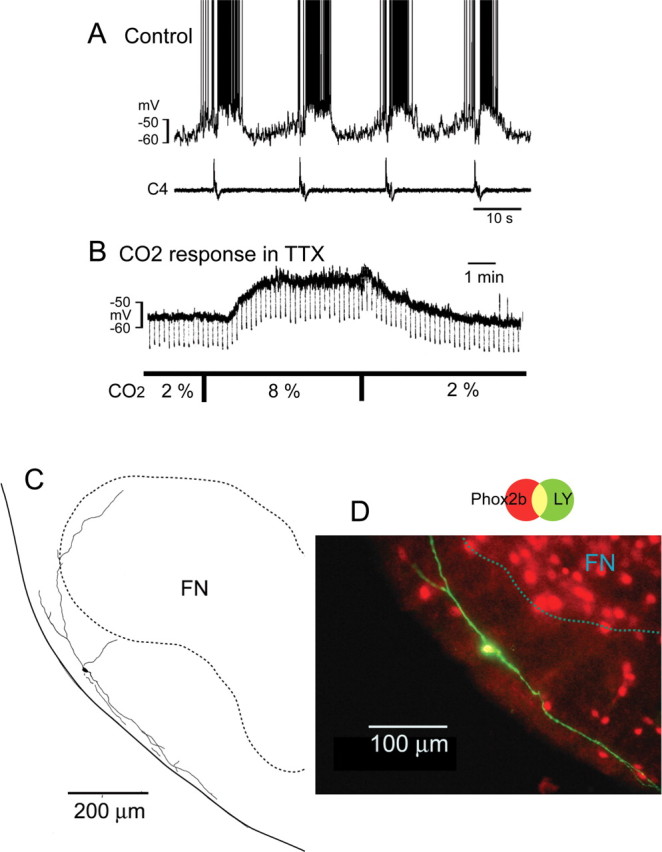
A Phox2b-immunoreactive Pre-I neuron in parafacial region. The neuron was recorded at the level of 400 μm rostral to the caudal end of facial nucleus. A, Membrane potential trajectory and C4 inspiratory activity. B, Membrane potential change in response to hypercapnia in the presence of 0.5 μm TTX. CO2 concentration was changed from 2% to 8%. Square current pulse (500 ms, 0.1 Hz, 20 pA) was applied to monitor change of input resistance. Negative deflections of the baseline membrane potential are proportional to input resistance. Note that application of 8% CO2 induced membrane depolarization and increase of input resistance. C, Camera lucida drawing of the neuron. D, Phox2b immunoreactivity of this neuron. The neuron labeled with Lucifer yellow (green) in the electrode solution showed Phox2b immunoreactivity (red). FN, facial nucleus.