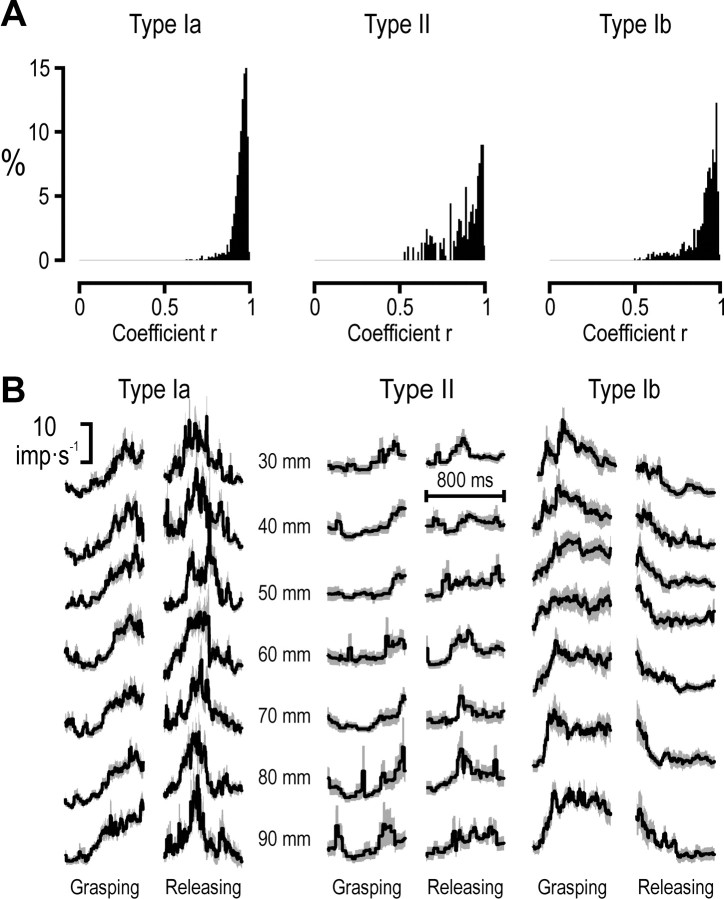
Figure 5.
Cross-validation of generated afferent populations. A, The distribution of r values of correlations between the responses averaged across all recorded afferents and the responses averaged over randomly drawn subsets of afferents (∼60% of the available afferents). B, The averaged population discharge rate ±SD (solid line and grayed area) for block sizes 30–90 mm during the grasping and releasing phases.

