
Figure 1.
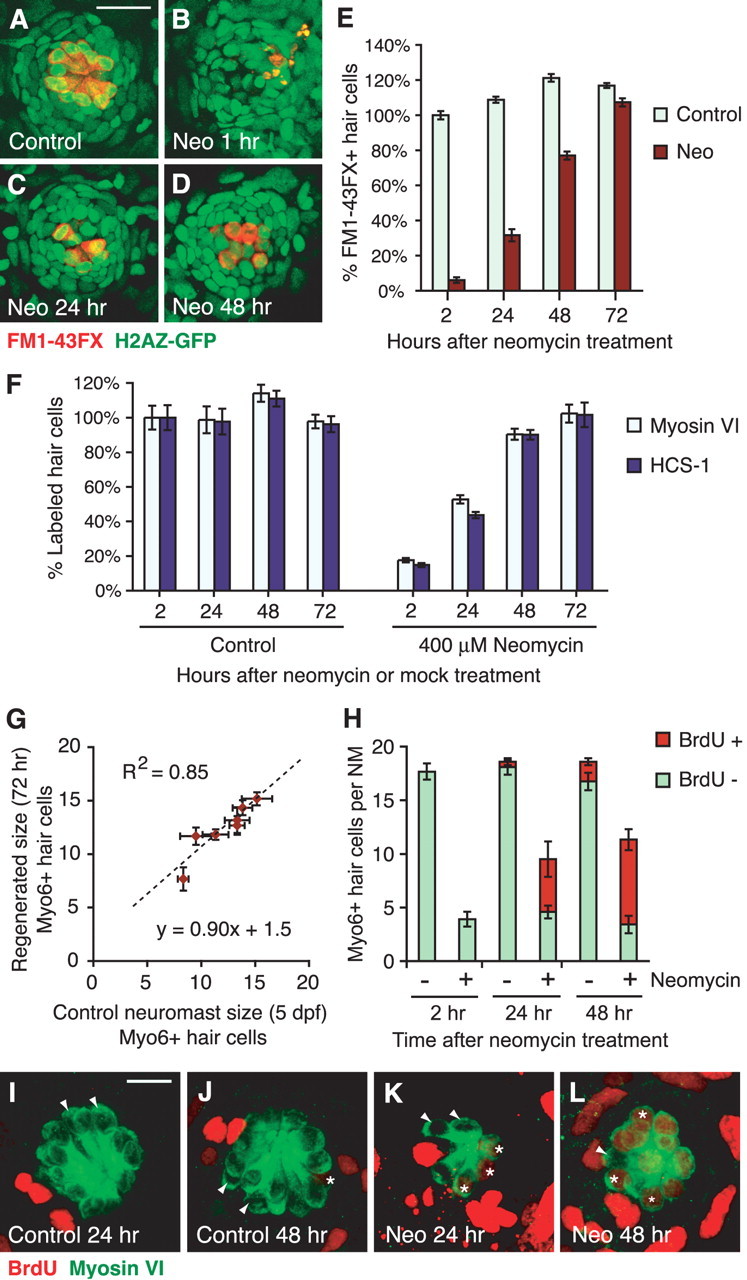
Hair cell regeneration in the zebrafish lateral line after neomycin-induced death. A–D, Confocal maximum projections of representative neuromasts of H2AZ-GFP transgenic zebrafish. GFP (green) was expressed in all nuclei, whereas mature HCs were labeled with FM1–43FX (red). Scale bar, 20 μm. Larvae 5 dpf (A) were treated with 400 μm neomycin (Neo) for 1 h (B) to kill HCs, rinsed, and left to recover. New HCs were observed at 24 h (C) and increased in number by 48 h (D). E, Graph of HC regeneration as seen with FM1–43FX. Results are graphed as mean percentages of HCs (± 1 SEM) normalized to the control at 5 dpf. n = 6 fish per condition, 7 neuromasts per fish; p < 0.001 (ANOVA). F, Graph of HC regeneration assayed with myosin VI and HCS-1 antibodies. Fish were concurrently labeled and counted for both HC markers. Results are normalized to 5 dpf controls for each neuromast for the specific marker. Error bars represent ±1 SEM (n = 6 fish per condition, 7 neuromasts per fish). G, Number of regenerated HCs correlates with the original size of the neuromast. Mean HC numbers (±1 SEM) for seven neuromasts, as labeled with myosin-VI, at 72 h after neomycin exposure are plotted relative to the 5 dpf control siblings. The line of best fit and correlation coefficient was calculated and drawn. H–L, New HCs mainly originate from proliferative progenitors. Continuous exposure to BrdU after neomycin exposure was used to label all proliferating cells and their progeny. Fish were colabeled for both BrdU (red) and myosin-VI (green) (I–L). H, Stacked graph of mean (±1 SEM) myosin-VI-labeled HCs per neuromast either colabeled with BrdU (red) or BrdU-negative (green). n = 4 fish per condition, 3 neuromasts per fish. I–L, Confocal maximum projections of representative neuromasts continuously exposed to BrdU, collected at 24 and 48 h after initial neomycin exposure. BrdU-positive (asterisks) and BrdU-negative (arrowheads) HCs were observed. Scale bar, 10 μm.