
Figure 2.
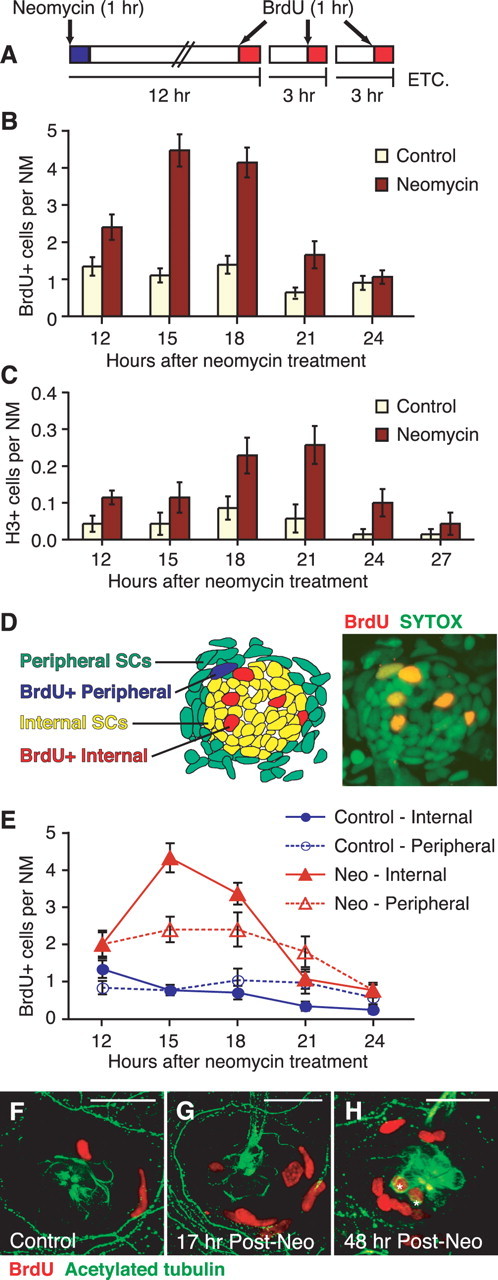
Support cell proliferation temporarily increases after neomycin exposure. A, Experimental protocol for BrdU pulse-fix time course. Larvae were pulsed with 10 mm BrdU for 1 h before fixing. B, C, Time course graphs of SC proliferation showing neuromast cells in S-phase (B) as assayed with BrdU pulse fix, and M-phase (C) as seen with anti-phosphohistone (H3) antibody labeling. A significant transient increase in proliferation occurring after neomycin exposure was seen with both proliferation markers (ANOVA; p < 0.001). Error bars represent ±1 SEM (n = 10 fish per condition; 7 neuromasts per fish). D, Schematic showing the internal (yellow) and peripheral (green) SC subpopulations within a representative neuromast. The schematic was drawn from the confocal image on the right, a neuromast labeled with 1 h of BrdU (red) at 15 h after neomycin treatment and counterstained with SYTOX (green). E, BrdU pulse-fix time course graph of SC proliferation after mock (blue, circle) or neomycin (red, triangle) treatment, subdivided as internal (solid lines, solid shape) or peripheral (dotted lines, open shape) based on neuromast cell position. Error bars represent ±1 SEM (n = 10 fish per condition; 3 neuromasts per fish). F–H, Confocal maximum projections of representative neuromasts at 17 h after mock treatment (F) or neomycin exposure (Post-Neo) (G) incubated with BrdU (1 h) before fixing. A subset of the neomycin-treated BrdU-pulsed fish were then rinsed and left to recover in fresh EM for an additional 31 h (48 h time point) (H). Immunohistochemistry was performed for both BrdU (red) and acetylated tubulin (green), another HC marker. BrdU label was present in a subset of HCs (asterisks) after additional recovery (H), indicating that these new HCs were generated from proliferating SCs at 17 h after neomycin exposure. Scale bar, 20 μm.