
Figure 4.
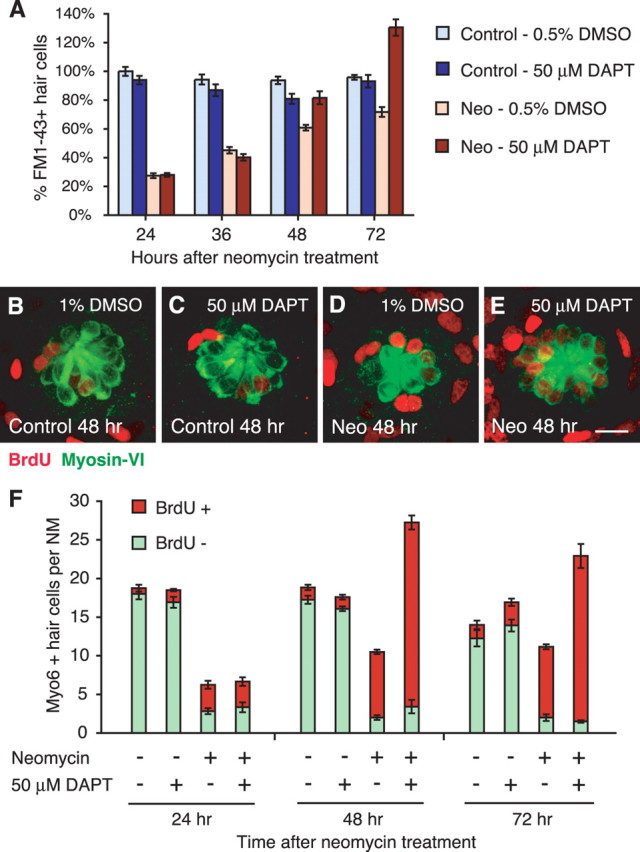
Notch inhibition results in excess regenerated hair cells. A, Graph of HC regeneration after 400 μm neomycin (Neo) exposure as seen with FM1–43FX in larvae with 50 μm DAPT incubation, a Notch inhibitor, or 0.5% DMSO vehicle control. Results are graphed as mean percentages of HCs (±1 SEM) normalized to the control at 5 dpf (n = 8 fish per condition; 6 neuromasts per fish). B–E, Confocal maximum projections of representative neuromasts under continuous BrdU incorporation for 48 h, with and without 50 μm DAPT. Hair cells were labeled with myosin-VI (green), and BrdU-labeled cells are red. Scale bar, 10 μm. F, Stacked graph of average myosin-VI-labeled HCs per neuromast either colabeled with BrdU (red) or are BrdU-negative (green). Excess HCs with 50 μm DAPT incubation all contained the BrdU label, indicating mitotic origin. Error bars represent ±1 SEM (n = 4 fish per condition; 3 neuromasts per fish).