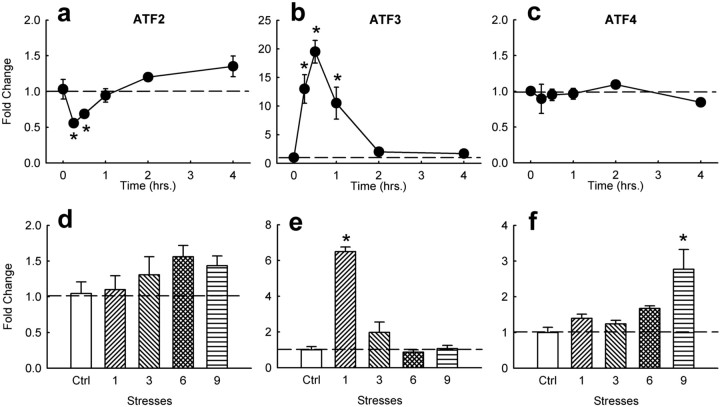
Figure 2.
Effect of stress on ATF2, ATF3, and ATF4 mRNA expression in striatum. a–c, Time course of ATF2, ATF3, and ATF4 mRNA levels by acute restraint stress. Points represent mean ± SEM relative induction from nonstressed controls (n = 4). d–f, Effect of acute and repeated restraint stress on ATF2, ATF3, and ATF4 mRNA levels compared with nonstressed controls (Ctrl) at 1 h after the last stress. Asterisks denote statistical difference (*p < 0.05) from nonstressed controls.

