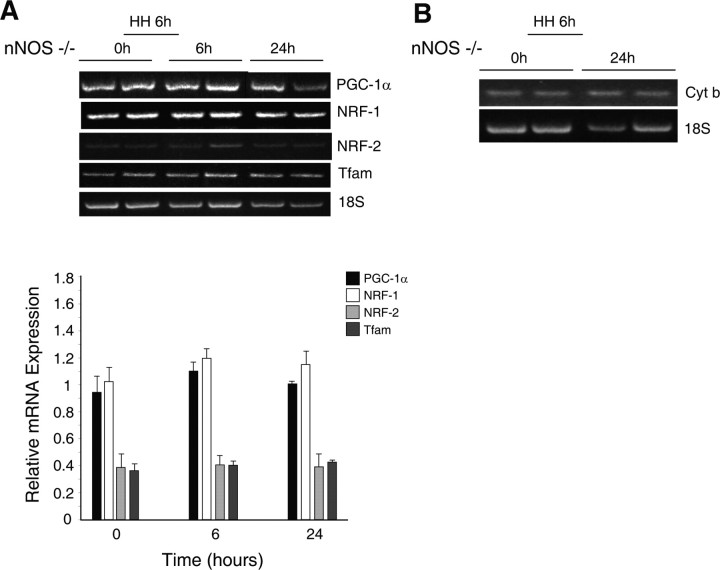
Figure 7.
Mitochondrial biogenesis in the brains of nNOS−/− mice exposed to HH. A, mRNA levels for mitochondrial biogenesis markers. GelStar-stained 2% agarose gels demonstrating RT-PCR products from subcortex in nNOS−/− mice are shown on top. RNA was prepared from control brain (0 h) and after hypoxia (6 and 24 h). Gene expression for PGC-1α, NRF-1, NRF-2, and Tfam was measured with RT-PCR using 18S rRNA to control for RNA loading and amplification (bottom). Values are mean ± SEM for four animals at each time (no significant differences compared with control). B, mtDNA content. Representative gel showing PCR products for mitochondrial cytochrome b. DNA was obtained from subcortex of nNOS−/− control mice and at 6 and 24 h after HH.

