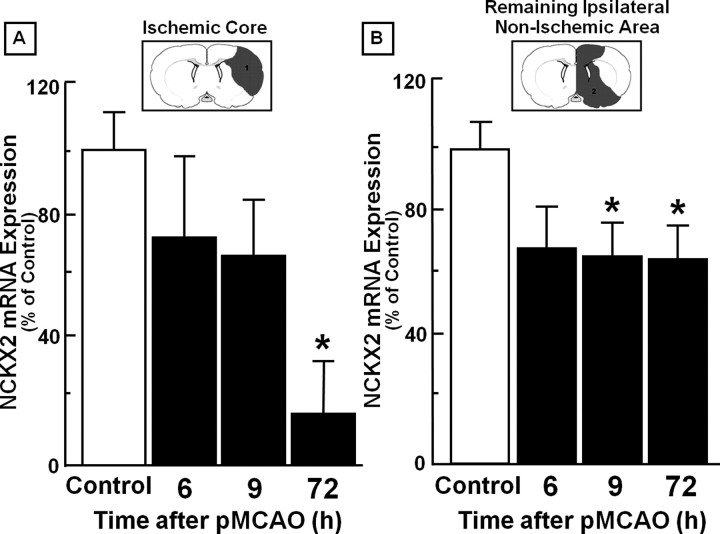
Figure 1.
Time course of NCKX2 mRNA expression after pMCAO in the ischemic core and in the remaining ipsilateral nonischemic area. A, B, Real-time PCR of NCKX2 mRNA expression in the ischemic core (A) and in the remaining ipsilateral nonischemic area (B) are represented. Data were normalized on the basis of GAPDH levels and expressed as a percentage of sham-operated controls, taken as 100%. Values represent means ± SEM (n = 7). *p < 0.05, compared with control animals.

