Figure 7.
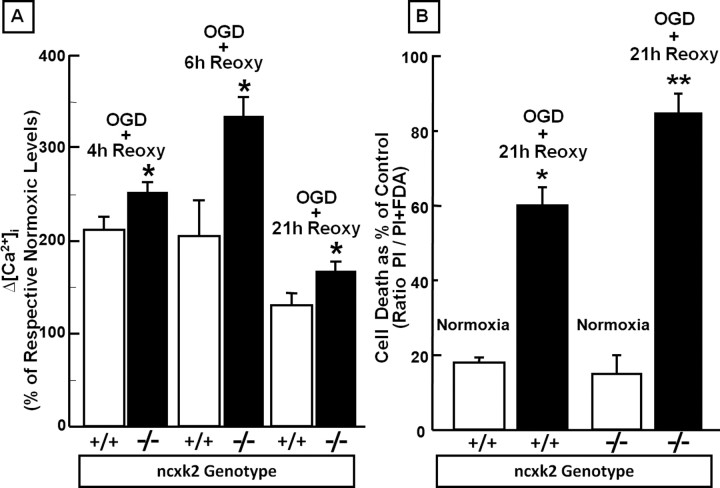
Effect of nckk2 genetic ablation on [Ca2+]i in cortical neurons exposed to OGD followed by reoxygenation and on cell survival in cortical neurons exposed to OGD plus reoxygenation. A, The bar graph depicts the quantification of [Ca2+]i detected with fura-2 AM in 7–10 DIV cortical neurons from nckx2+/+ and nckx2−/− mice exposed to 3 h of OGD followed by 4, 6, and 21 h of reoxygenation and expressed as Δ% [Ca2+]i of the respective normoxic [Ca2+]i levels. *p < 0.05 versus respective normoxic basal level and versus nckx2+/+. Each bar represents the mean ± SEM of the at least 70 experimental values studied in three independent experimental sessions. B, The quantification of cell death occurring in 7–10 DIV cortical neurons from nckx2+/+ and nckx2−/− mice exposed to 3 h of OGD followed by 21 h of reoxygenation is shown. Sister cultures were incubated for 24 h in normoxic buffers and constituted the internal controls. At the end of the experiments, cells were stained with PI and fluorescein, and images were acquired as reported in Material and Methods. The data are reported as the percentage of cell death occurring in each group compared with its respective normoxic cells. *p < 0.05 versus respective normoxic neurons; **p < 0.05 versus its normoxic neurons and nckx2+/+ neurons exposed to 3 h of OGD followed by 21 h of reoxygenation. Each bar represents the mean ± SEM of three different experimental values.

