
Figure 1.
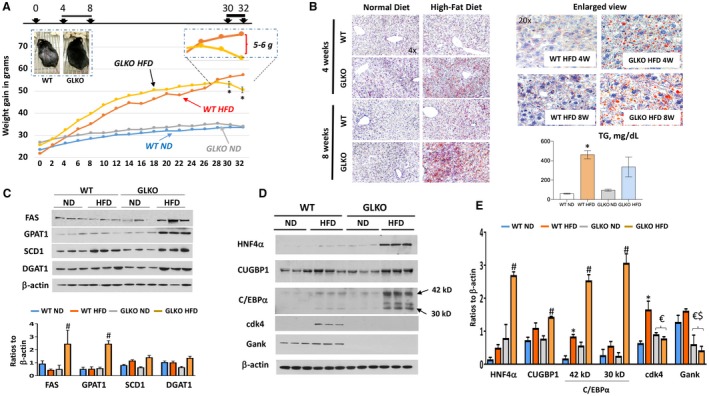
GLKO mice show a healthy appearance under the HFD protocol and have more steatosis. The data of line and bar graphs represent mean ± SEM. (A) Study time course of HFD versus ND in GLKO and WT mice, *P < 0.05 WT HFD versus GLKO HFD. Inserted images show pictures of WT and GLKO mice at 12 weeks of the HFD protocol (left image) and enlarged section of HFD WT and GLKO mice at 30‐32 weeks (right image). Images were taken using a camera with size 12.2 Megapixel, 1.4 micropixel. (B) Oil Red‐O staining of WT and GLKO mouse livers at 4 and 8 weeks of the HFD protocol. Right images show enlarged view of staining at Magnification 20×. Bar graph shows levels of hepatic TGs after 8 weeks of the HFD, *P < 0.05 WT ND versus WT HFD. (C) Expression of the enzymes of fatty liver development in WT and GLKO mice treated with an ND and an HFD. Bar graph shows ratios of the proteins to loading control, #P < 0.05 GLKO ND versus GLKO HFD. (D) Levels of CUGBP1, HNF4α, C/EBPα, and cdk4 proteins by western blot. (E) Bar graph shows quantification of protein levels of proteins on D relative to β‐actin, *P < 0.05 WT ND versus WT HFD; #P < 0.05 GLKO ND versus GLKO HFD; $P < 0.05 WT ND versus GLKO ND or GLKO HFD; €P < 0.05 WT HFD versus GLKO ND or GLKO HFD. Abbreviation: W, weeks.