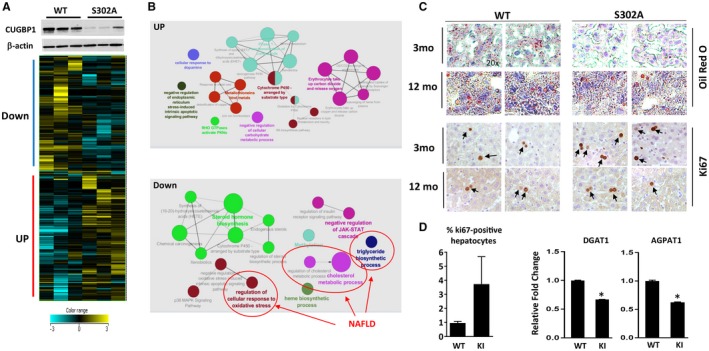
Figure 5.

CUGBP1‐S302A mice at 2 months of age have reduced steatosis and increased liver proliferation. All the bar graphs represent mean ± SEM. (A) Heat map of the RNA‐Seq analyses of three WT and three CUGBP1‐S302A mice. Upper image shows levels of CUGBP1 in the analyzed mice determined by western blotting. (B) Network of pathways which are up‐ and down‐regulated in S302A mice compared to WT mice. Down‐regulated pathways involved in the development of NAFLD are shown. (C) Oil Red O and ki67 staining of livers of WT and S302A mice. Arrows show ki67‐positive hepatocytes; magnification at 20×. (D) Bar graphs show percentage of ki67‐positive hepatocytes and mRNA levels coding for enzymes involved in fatty liver development, *P < 0.05 WT versus S302A KI. Abbreviations: Down, down‐regulated; JAK‐STAT, Janus kinase/signal transducer and activator of transcription; mo, months; UP, up‐regulated.
