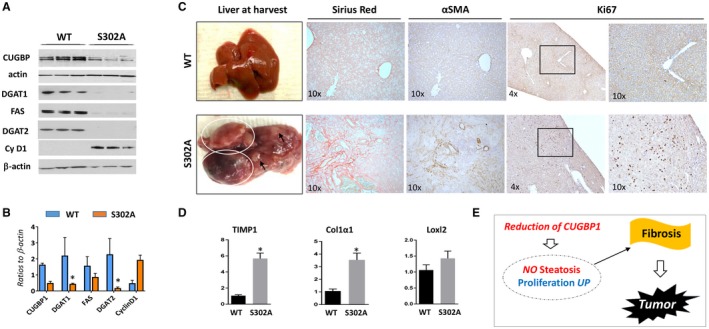
Figure 6.

CUGBP1‐S302A mice develop fibrosis and liver tumors at the age of 17‐22 months. All the bar graphs represent mean ± SEM. All the bar graphs represent mean ± SEM. (A) Levels of fatty liver markers and cyclin D1 in 2‐month‐old WT and S302A mice were examined by western blotting. (B) Levels of proteins in section A were calculated as ratios to β‐actin, *P < 0.05 WT versus S302A KI. (C) (Left) Typical pictures of livers of WT (control) and S302A mice that develop tumors. (Right) Sirius red, αSMA, and Ki67 staining of the livers shown on the left. (D) mRNA levels of markers of fibrosis were determined by qRT‐PCR in WT and CUGBP1‐S302A mice, *P < 0.05 WT versus S302A KI. (E) Hypothesis for the role of steatosis and proliferation in the development of fibrosis and tumors in CUGBP1 S302A mice. Abbreviations: αSMA, α smooth muscle actin; Cy D1, cyclin D1; UP, up‐regulated.
