Figure 6.

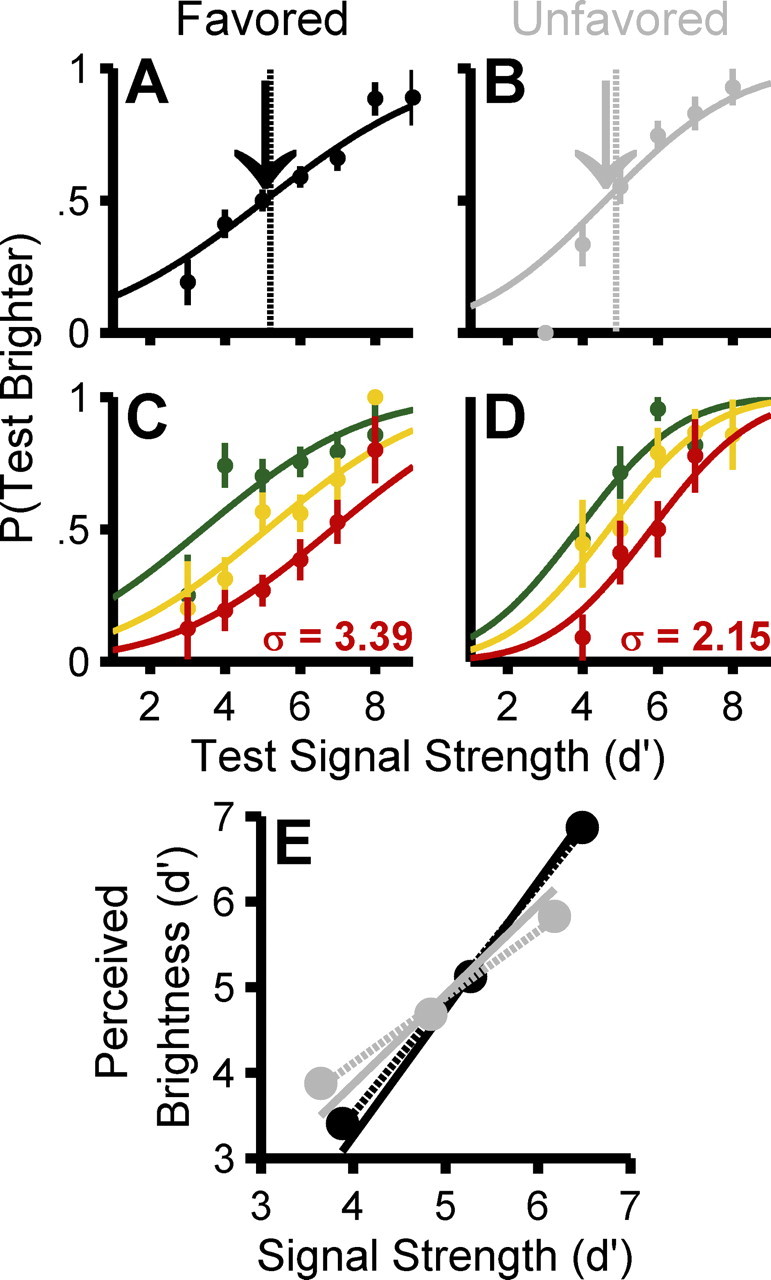
Example raw psychometric data for one naive subject from two experimental runs. Top panels show “saccade-choice-triggered” psychometric functions plotting the proportion of “test brighter” responses as a function of the signal strength of the test stimulus at the favored (A) and unfavored (B) locations (±1 binomial SEM). The vertical dashed line indicates the mean objective signal strength; the arrow shows the PSE of the cumulative Gaussian fit to the data from Equation 2 (perceived overall brightness). C and D show psychometric functions with the luminance distribution of the saccadic-target strength subdivided into thirds. The shift between these functions shows the change in perceived brightness as a function of the physical signal strength of the chosen stimulus increased (perceptual gain). The shallowness of these functions quantifies the amount of uncertainty in the perceptual response (perceptual noise). For clarity, all psychometric functions (A–D) only plot points derived from at least four trials. In E, the filled circles plot perceived brightness (PSEs of the 3 psychometric curves from Eq. 3) as a function of signal strength at the favored (black) and unfavored (gray) locations. Dashed lines show a linear regression across these three points (favored slope, 1.33; unfavored slope, 0.77); solid lines show a continuous fit to the psychophysical data using Equation 4 (favored slope, 1.49; unfavored slope, 1.05). Both methods indicate higher perceptual gain at the favored location. All subsequent figures report quantitative measures of perceptual gain using the continuous measure, but the results are qualitatively similar using the binned method.
