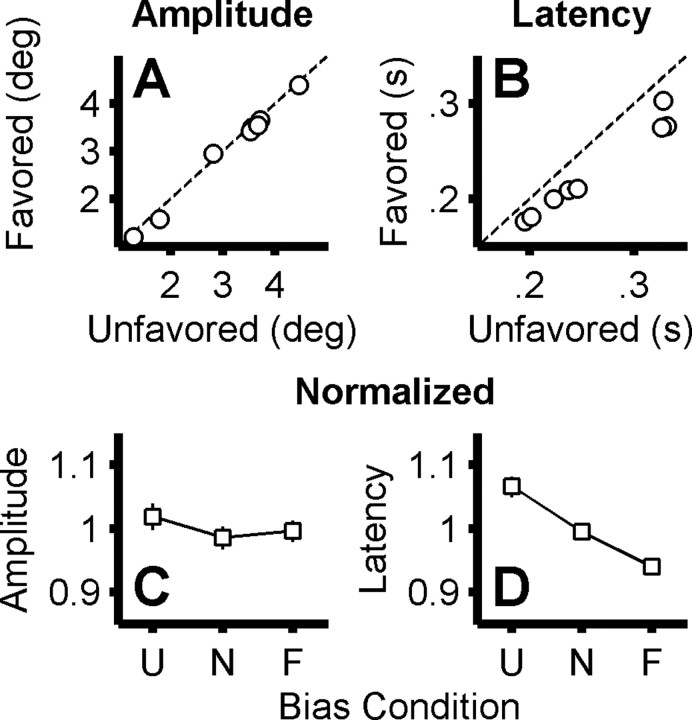
Figure 8.
Analysis of saccade metrics. A compares the mean amplitude of saccades made to the favored and unfavored locations. Each circle represents data from one case (1 subject in 1 bias paradigm), and the 95% confidence interval is smaller than the circle in all cases. B compares the median latency of saccades made to the favored and unfavored locations (same conventions as A). Again, the 95% confidence interval is smaller than the circle in all cases. C shows the average saccade amplitude, normalized within subject (by dividing by the subject's average amplitude across conditions and saccade directions) plotted as a function of bias condition (U, unfavored; N, neutral; F, favored; p = 0.44, one-way ANOVA). Error bars represent SEM across cases and saccade directions. D shows the average saccade latency, normalized within subject (by dividing by the subject's average latency across conditions and saccade directions) plotted as a function of bias condition (p < 0.0001, one-way ANOVA).

