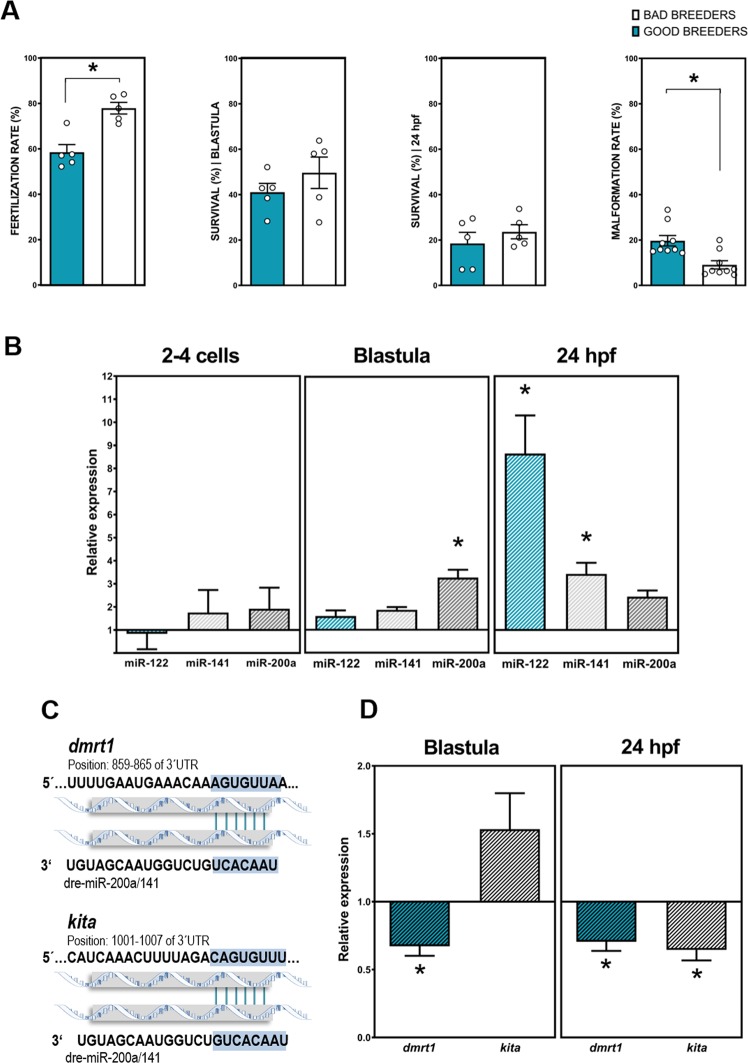
Figure 4.
Progeny analyses from zebrafish good and bad breeders. (A) Percentage (%) of fertilization rate, embryo survival in blastula and 24 hpf stages and malformation rate in zebrafish progenies from good and bad breeders. (B) Relative expression of each microRNA calculated using the 2−ΔΔCt method at three different early developmental stages (2–4 cells, blastula and 24 hpf). The figure shows expression of each microRNA in the bad breeders relative to that in good breeders, which was set to 1. Data are expressed as the mean ± SEM of 2−ΔΔCt values from five independent in vitro fertilizations. Asterisks represent significant differences (p < 0.05) between experimental groups. (C) miR-200a-5p and 141-3p target analysis and the seeds matched in the 3′-UTR of each target gene. (D) Relative expression levels for each gene relative to the housekeeping genes actin beta 2 (actb2) and elongation factor 1 alpha (ef1α) were calculated for all samples using the 2−ΔΔCt method. The figure shows expression of each gene in the progenies form bad breeders at two developmental stages (blastula and 24 hpf) relative to that progeny of good males, which was set to 1. Data are expressed as the mean ± s.e.m. of 2−ΔΔCt values from three independent experiments with three replicates for each. Asterisks represent significant differences (p < 0.05) between experimental groups.

