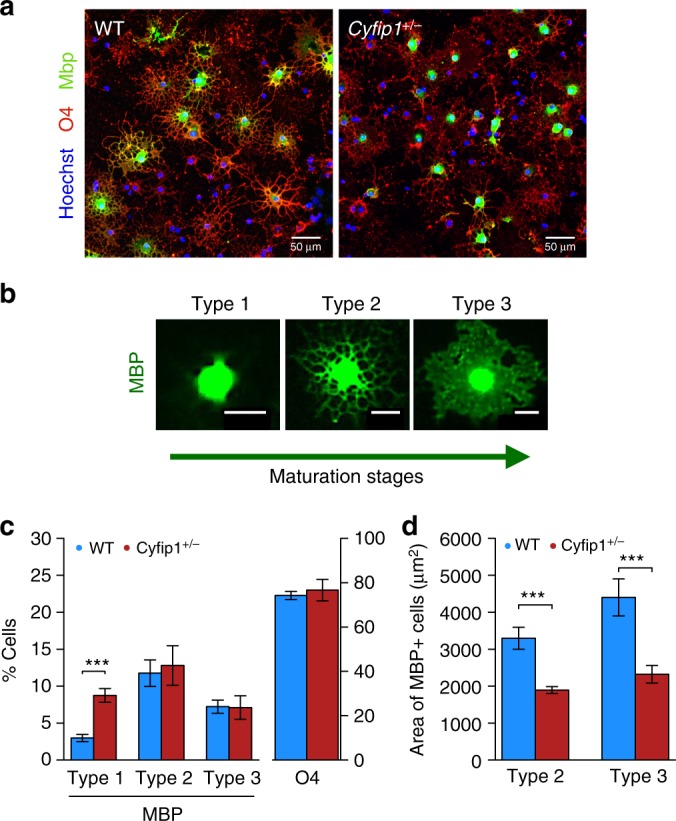
Fig. 4.

Cyfip1 haploinsufficiency influences the intracellular distribution of myelin basic protein (MBP) in cultured oligodendrocytes. a Immunostaining of oligodendrocytes for MBP and O4 from wild type (WT) and Cyfip1+/−, scale bar = 50 μm, illustrating the punctate intracellular pattern of staining of MBP in Cyfip1+/− relative to the more diffused, widespread pattern of staining in WT. b Representative images of oligodendrocytes staining for MBP exhibiting features of Type 1 (MBP localised to the cell body), Type 2 (MBP ramifying into the cell processes), Type 3 (MBP distributed throughout the cell and within the membranes of cell processes) reflecting increasing maturation stages of oligodendrocytes, scale bar = 20 μm. c the effects of genotype on the percentage of Type 1 (n = 172 WT and 637 Cyfip1+/− cells; LME: χ2(1) = 68.49, ***), Type 2 (n = 735 WT and 905 Cyfip1+/− cells, LME: χ2(1) = 0.59, p = 0.44), Type 3 (n = 456 WT and 454 Cyfip1+/− cells; LME: χ2(1) = 0.02, p = 0.88), and O4 + cells (n = 4917 WT and 5789 Cyfip1+/− cells; LME: χ2(1) = 1.44, p = 0.23), as a proportion of all cells (n = 6623 WT and 7845 Cyfip1+/− cells) in the culture (stained with Hoechst); this panel also illustrates the effects of genotype on the overall proportion of differentiating oligodendrocytes as indexed by all cells staining for O4. d effects of genotype on the area of intracellular MBP staining in Type 2 (n = 491 WT and 591 Cyfip1+/− cells; LME: χ2(1) = 258.03, ***) and Type 3 (n = 265 WT and 341 Cyfip1+/− cells; LME: χ2(1) = 145.52, ***) oligodendrocytes, as depicted in the representative images in b. Values were obtained from 3 independent experiments. Differences between number of cells and area were quantified using linear mixed effects (LME) models adjusted for variability in each biological repeat. Data are mean ± SEM; *<0.05, **<0.01, ***<0.001. Source data are provided as a Source Data file
