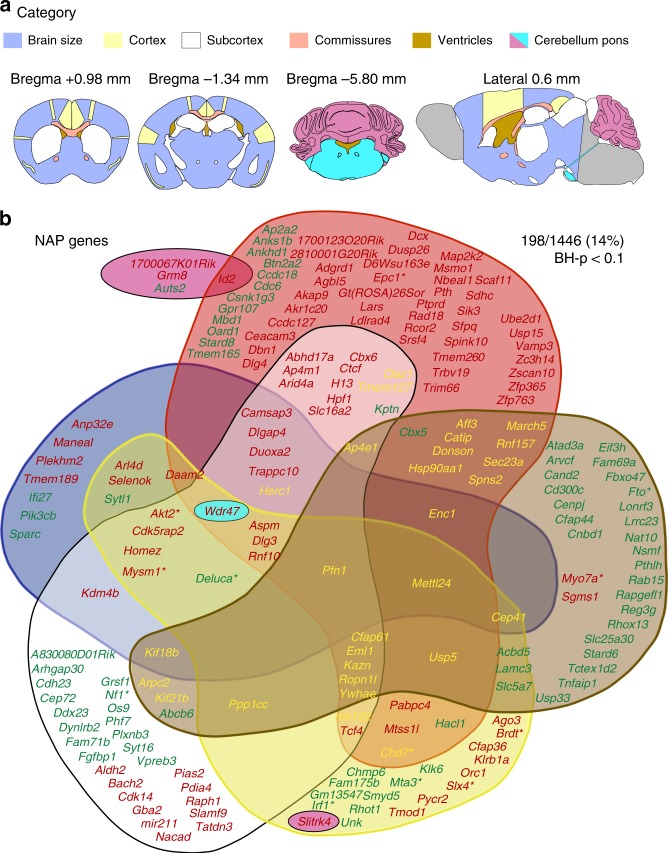
Fig. 1.
Gene identification for neuroanatomical phenotypes. a One hundred and eighteen brain parameters (Supplementary Data 4; Supplementary Fig. 2) are grouped into six categories (brain size, cortex, subcortex, commissures, ventricles and cerebellum/pons) on coronal and sagittal sections at the indicated positions. b NeuroAnatomical Phenotype (NAP) genes (mouse genes whose disruptions yield a neuroanatomical defect) are positioned on each category and color-coded. Red font corresponds to decrease in structure size, green to increase, yellow to both, and asterisks refer to the 6-week dataset (Supplementary Notes). BH-p < 0.1 corresponds to the adjusted Benjamini–Hochberg p value using a linear mixed model

