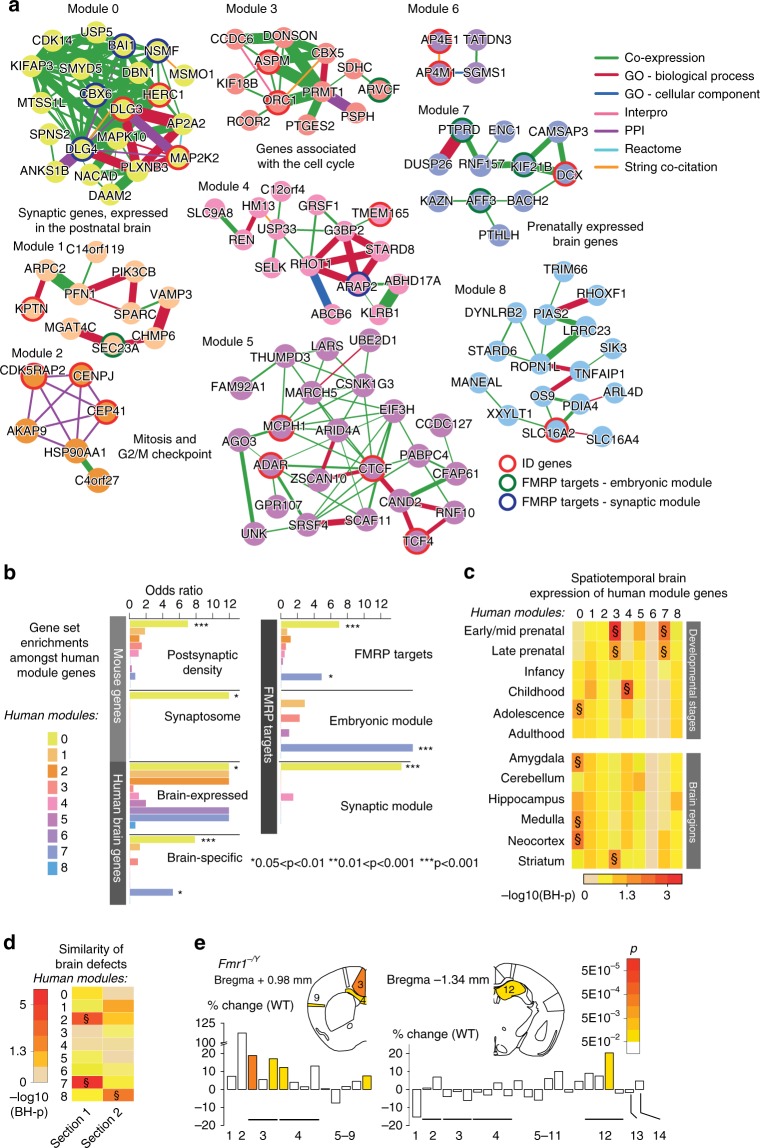
Fig. 5.
Functional characterization of human gene modules. a The PLN (Phenotypic Linkage Network) identifies 381 functional links between 121 human orthologs of NeuroAnatomical Phenotype (NAP) genes, which partitioned into the 9 modules of closely related genes (illustrated by the color of the nodes). The thickness of each edge is proportional to the functional similarity score, as given by the PLN, and the color of each edge indicates the largest contributing information source. Red borders depict known ID-associated genes, whereas blue and green borders refer to the set of embryonically expressed and mature Fragile X Mental Retardation Protein (FMRP) target genes, respectively. Module descriptions were added, where clearly discernable. b Gene set enrichment analysis across the nine human modules. c Spatiotemporal expression dynamics of module genes compared to the remaining NAP orthologs. d The heat map depicts the similarity of brain abnormalities caused by module genes in the critical sections 1 and 2 (Bregma +0.98 mm and −1.34 mm, respectively). The color code corresponds to the adjusted p value with double S (§) referring to BH-p < 0.05 (c, d; permutation test). e New neuroanatomical study of Fmr1−/Y in the coronal plane (n = 4 wild types (WTs) and n = 6 Fmr1−/Y, male). Top: Schematic representation of the affected brain parameters at Bregma +0.98 mm and −1.34 mm. Numbers refer to the same brain parameters from Fig. 2b and Supplementary Fig. 2b, c. The color code indicates the unadjusted p value. Bottom: Histograms showing the percentage of increase/decrease of the brain parameters compared to WTs

